
Second Half 2023 Market Outlook 2023 | The Old Normal part 2 – Down then Up
I am Chris Perras, Chief Investment Officer at Oak Harvest Financial Group, we are a retirement planning and investment management advisor located in Houston Texas. Welcome to our 2nd Half 2023 Market Outlook, YouTube, Stock Talk “Keeping you connected to your money”. Its title is a follow up to our first half piece. I’m making it easy and titling our second half 2023 outlook – “The Old Normal part 2, Down then Up”. We had expected a strong first half rally in the S&P 500 led by growth stocks as inflation concerns abated and real interest rates dropped. And that’s what we got. We published our first half target of 4300 in the S&P 500 last December when the average was trading near 3800. We called for lower volatility, lower inflation, and higher stock prices as many well known strategists were calling for a “new high volatility regime”, market crashes, replays of the dot.com bubble collapse, or at least a return and retest of the October lows of 3600.
We refuted the likelihood of those bearish outcomes in many of our weekly YouTube and website releases. Those negative forecasts did not materialize and many of those bears are still saying they weren’t wrong; they were just early. Up over 20% in the S&P 500 off the lows in 8 months. Up over 35% on the Nasdaq since the lows. The bears were not wrong. They were just early. Really? FWIW, equity strategist Mike Wilson at Morgan Stanley, who is widely quoted across financial media, does brilliant work in my book. However, if you check the tapes, and we do, his forecast was off by a 1000 S&P 500 points in 2021. That was a call that missed by over 25%. Yes, he was correct in 2022 sticking with his pessimistic tone. However, once again in the first half of 2023, he has been woefully wrong and is now off by almost 1500 points in 2023, that’s 50%, versus his Jan 4th call for the S&P500 to see 3000 in 2023 as “very achievable”. Did those calls or his forecast help you and your portfolio? Obviously, the answer is no.
Back in late 4th quarter 2021, 10-year real interest yields troughed at -1.25% and began to pivot higher throughout the 1st quarter 2022 and in front of the Fed’s interest rate hikes and Chairmen Powell reversing 180 degrees to full inflation hawk. Here’s that interest rate chart.
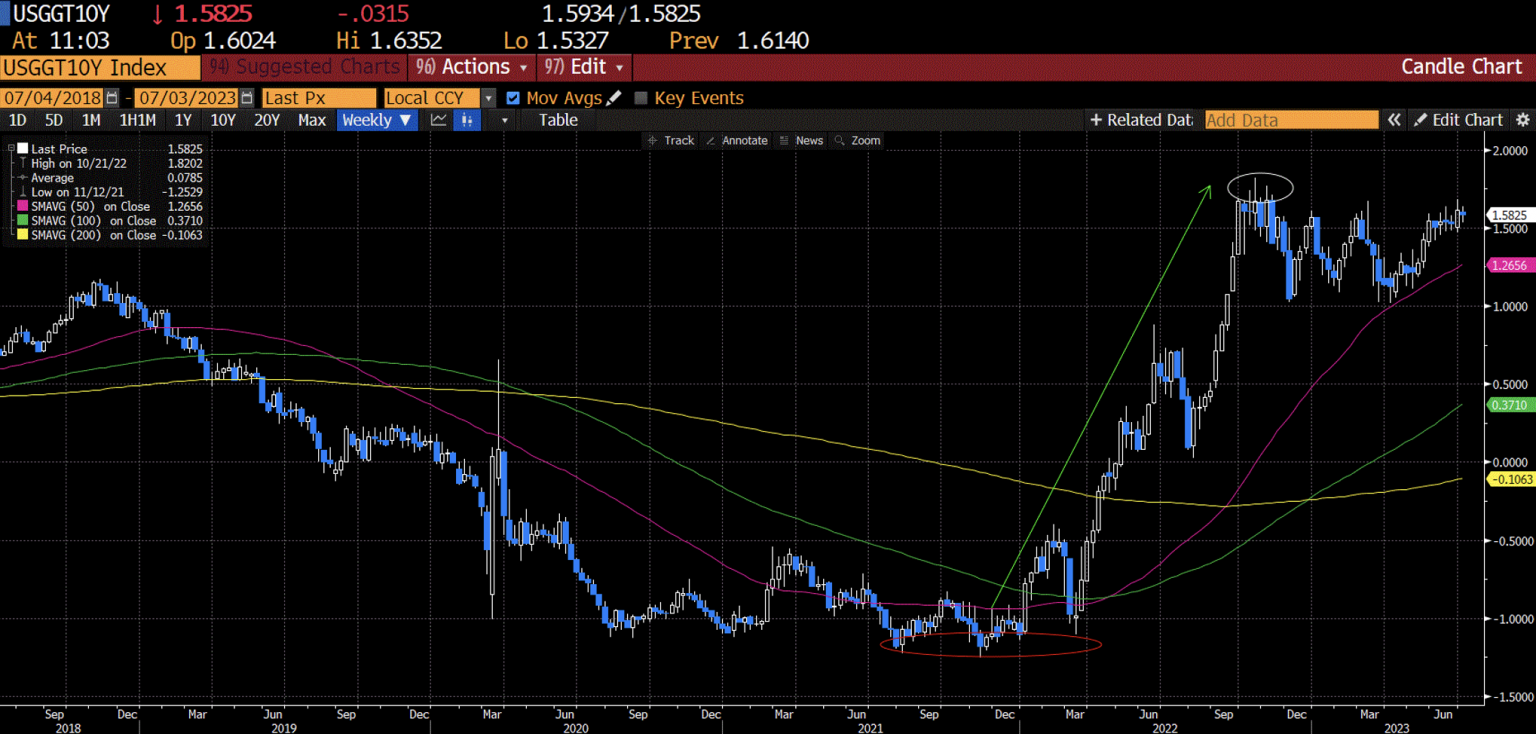
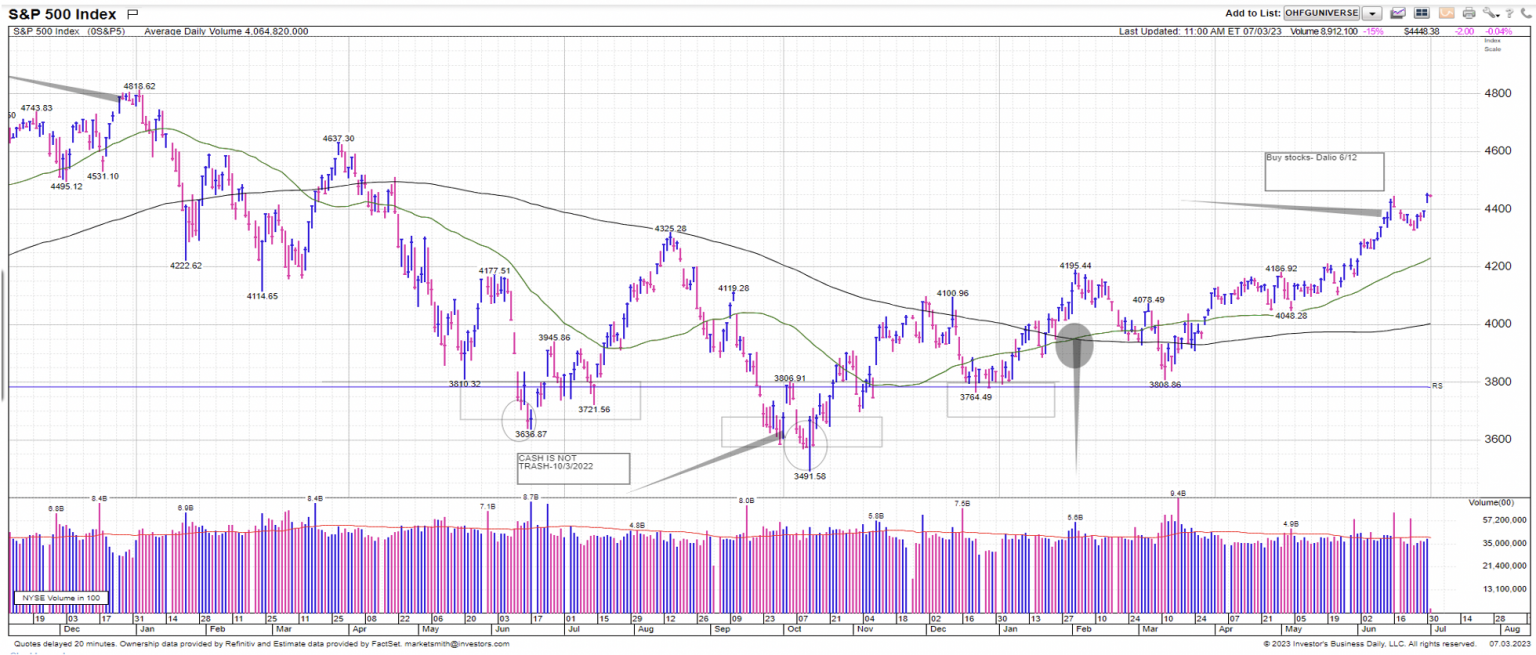
Real rates peaked when? In early to mid-October 2022? When did the S&P 500 reach its lows for 2022? Early to mid-October 2022. Here’s a daily chart on the S&P 500 with important dates highlighted to jog your memory.
I said it back last December and I’ll say it again. If I had one real-time chart that I wanted to follow to help guide my decision making on when should the stock market lows be in, and headwinds turn into tailwinds for stocks. It would probably be this chart. And what led in the first half of 2023? Higher growth technology and service stocks in the NASDAQ led the markets largely due to a combination of earnings growth, but primarily multiple expansion. Here’s a weekly chart on the NASDAQ.
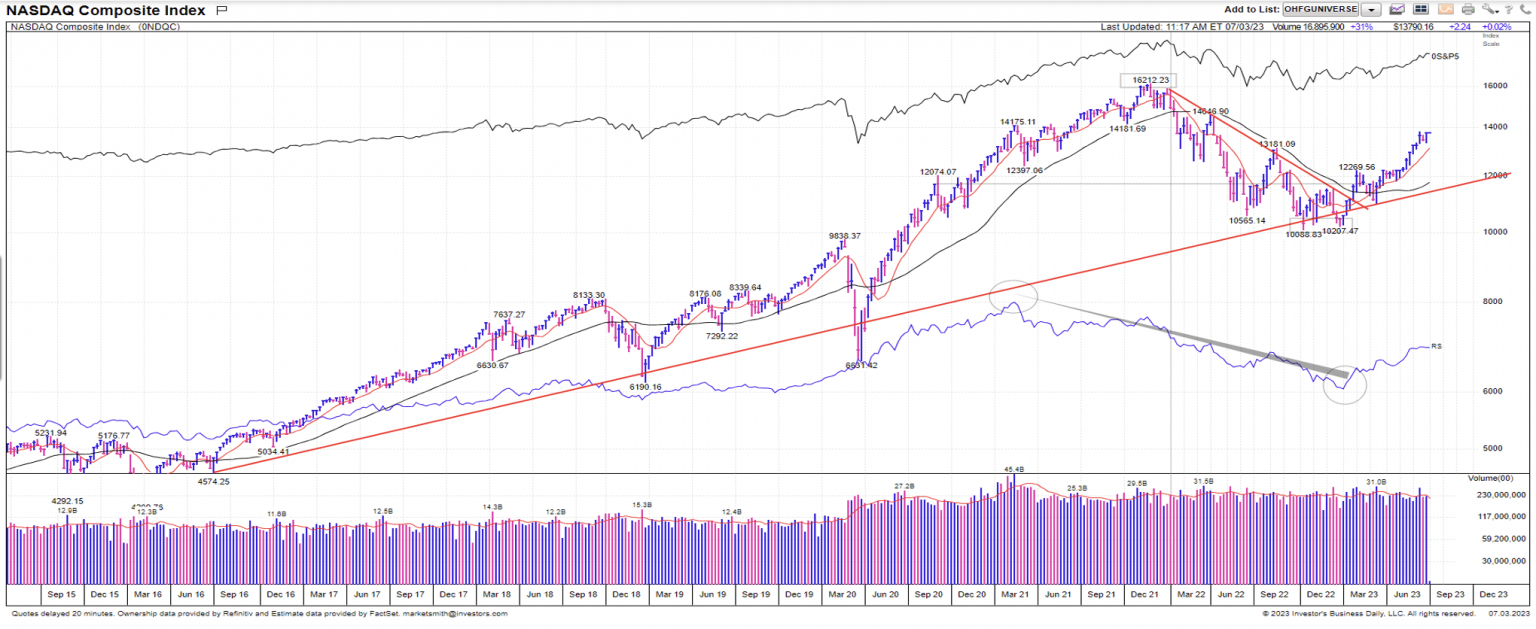
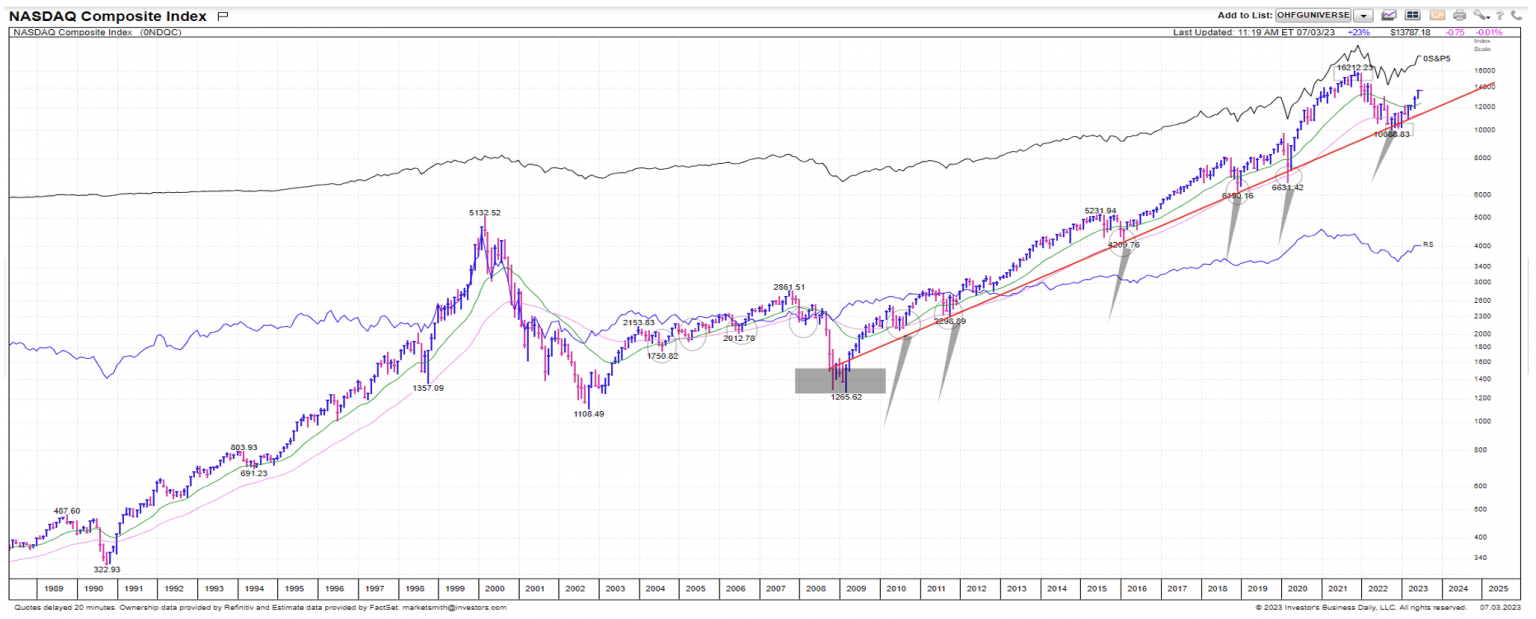
And now here’s the monthly chart in the Nasdaq. We had highlighted back in the 3rd and 4th quarter of 2022, how rare its been for the NASDAQ to trade down to or just below its 12 year uptrend line since the Great Financial Crisis. And how, when it has traded there, its previously been a strong buying opportunity. We expected this to be the case again and it was while many others were saying techs run was over, and the dot.com bubble 2.0 collpase was in process.
So now what? The second half outlook of 2023 should be a push and pull between two things predominantly. First, global Central banks still feel compelled to fight inflation. And each bank is in its own cycle and fight. Some are focused on things they can’t control as a Central bank, like energy and commodity prices. Other bankers, like our Federal Reserve, are focused on specific components of inflation like wages and housing which are largely affected by the demand for labor and employment markets. Does our Federal Reserve’s rate moves finally break our strong service and labor markets causing a more significant slowdown here in the United States? Secondly, the first half of 2023 brought a global economic slowdown in manufacturing led by China and Europe underperforming. The US has largely skated through the 2nd half of 2022 and 1st half of 2023 slowdown on the back of a reasonably strong employment markets, our consumer, private market reshoring capital spending, and Federal government spending programs kickstarted by the poorly named Inflation Reduction act.
Heading into the second half of 2023, the Fed has tightened monetary policy at a historically fast pace but sounds as if they have not finished their moves. Jobs are plentiful, but openings are slowing, layoffs are accelerating, and wage gains slowing quickly. The USA consumer is now more cautious spending except for housing, autos, and travel, now mainly buying what they need, not what they greed for. The cash S&P 500 index has regained the 4450 level. This is roughly 3% higher than our published forecast for the first half of 2023, but in line with our optimistic, possible but not probable, calculation based on volatility last December.
Inflation dropped throughout the first half of 2023 symmetrically to its rise in 2021 and 2022, much as we forecast. However, it is likely to remain above the Feds 2% goal in 2023 and 2024 due to demographic factors and tougher comps in the 2nd half of 2023. To do so, the Fed is likely going to keep interest rates they control, short term rates, “higher for longer” as they have said publicly. What does this look like in some of the real time data series we’ve previously discussed. Data series like “real interest rates”? It means real interest rates will likely go a bit higher in the 2nd half of 2023. We saw in 2022, a trend higher in real interest rates hurts the overall stock indexes, particularly growth stocks, as it translates into the ERP, equity risk premium, and negatively affects valuations and PE’s.
With this in mind, while longer term government yields have risen the last 18 months, shorter term rates have as well, and keeping time duration and maturities shorter in government bonds makes sense to our team given the likelihood of on-going volatility in government bond markets in the second half of 2023. With Fed governors still lobbing inflation grenades almost weekly in the media trying to restore their collective reputation, and the credit cycle late in its tooth, our investment team would still rather take on maturity “roll-risk” and stay in shorter term fixed income than lock into longer term maturities.
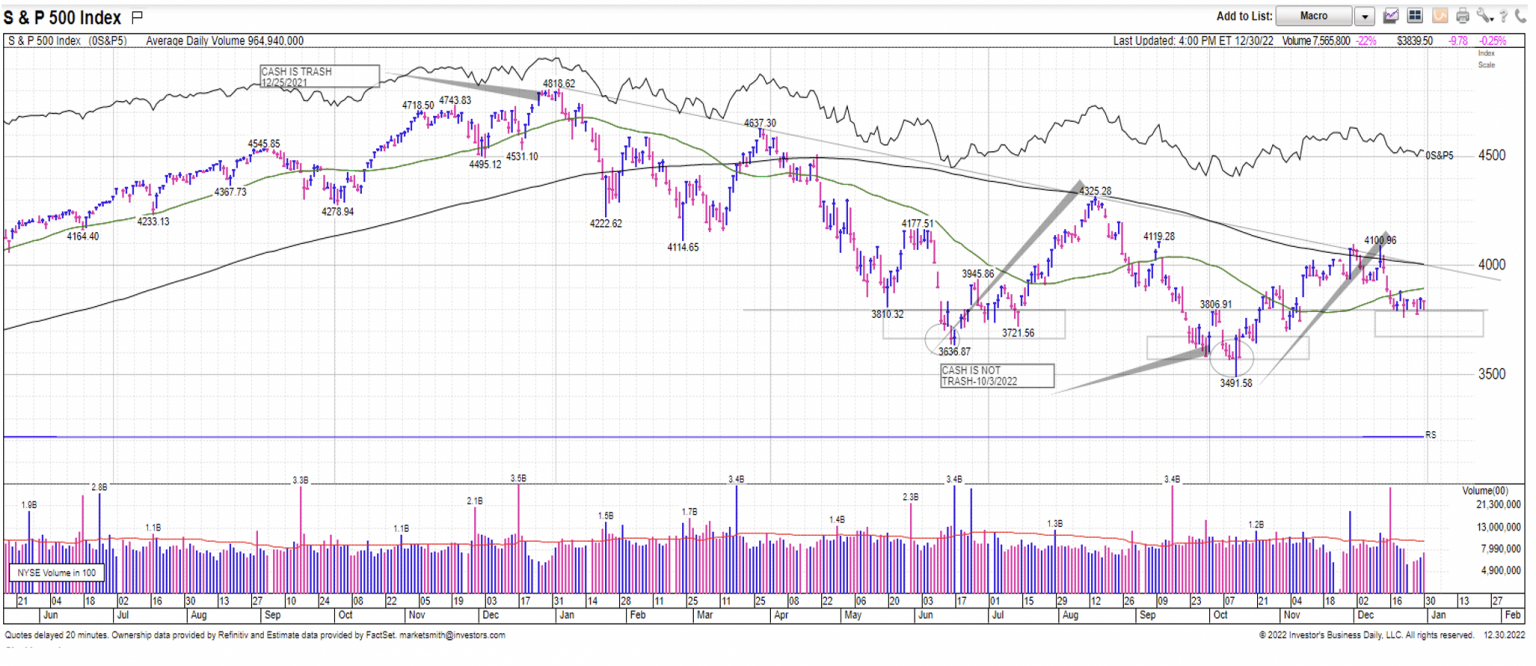
As for equities in the second half of 2023? What’s our Oak Harvest team thinking? Well exactly opposite last December, most chartists are now spouting how pretty a picture the S&P 500 has become. No longer is the S&P 500 down and too the right, failing at its uptrend on multiple occasions like it was for the first 9 months of 2022. Here’s it’s picture at year end 2022. Recall, we didn’t know exactly what or why things would happen back then when we were forecasting a 4300 first half 2023 rally.
Here is that same chart of the S&P 500 again as of July 4th holiday. A 2022 downtrend, has
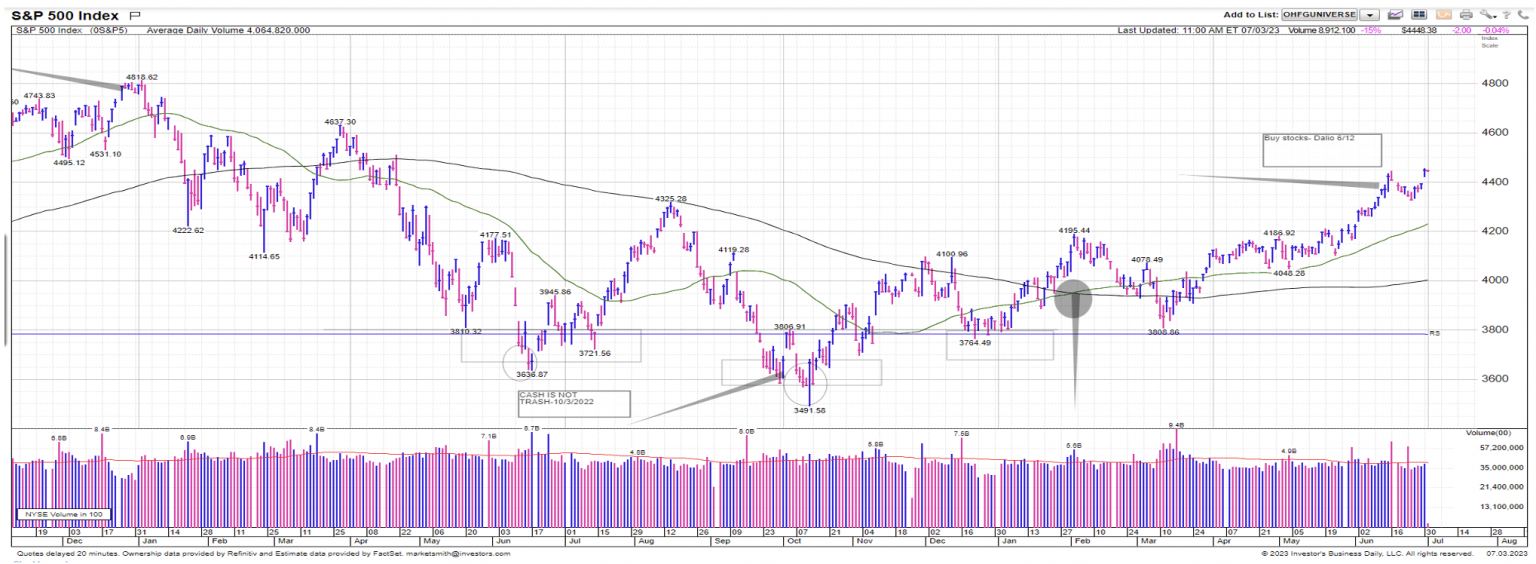
become a series of higher lows and higher highs in the first half of 2023. Chartists, who are generally trend followers, are now seeing the daily and weekly downtrends broken, and a series of higher lows and higher highs that we previously called for now. Now that we’ve broken back above the August 2022 Jackson Hole, “Powell Puke” as I call it, most chartists, strategists, and newsletter writers are finally jumping on the bullish bandwagon.
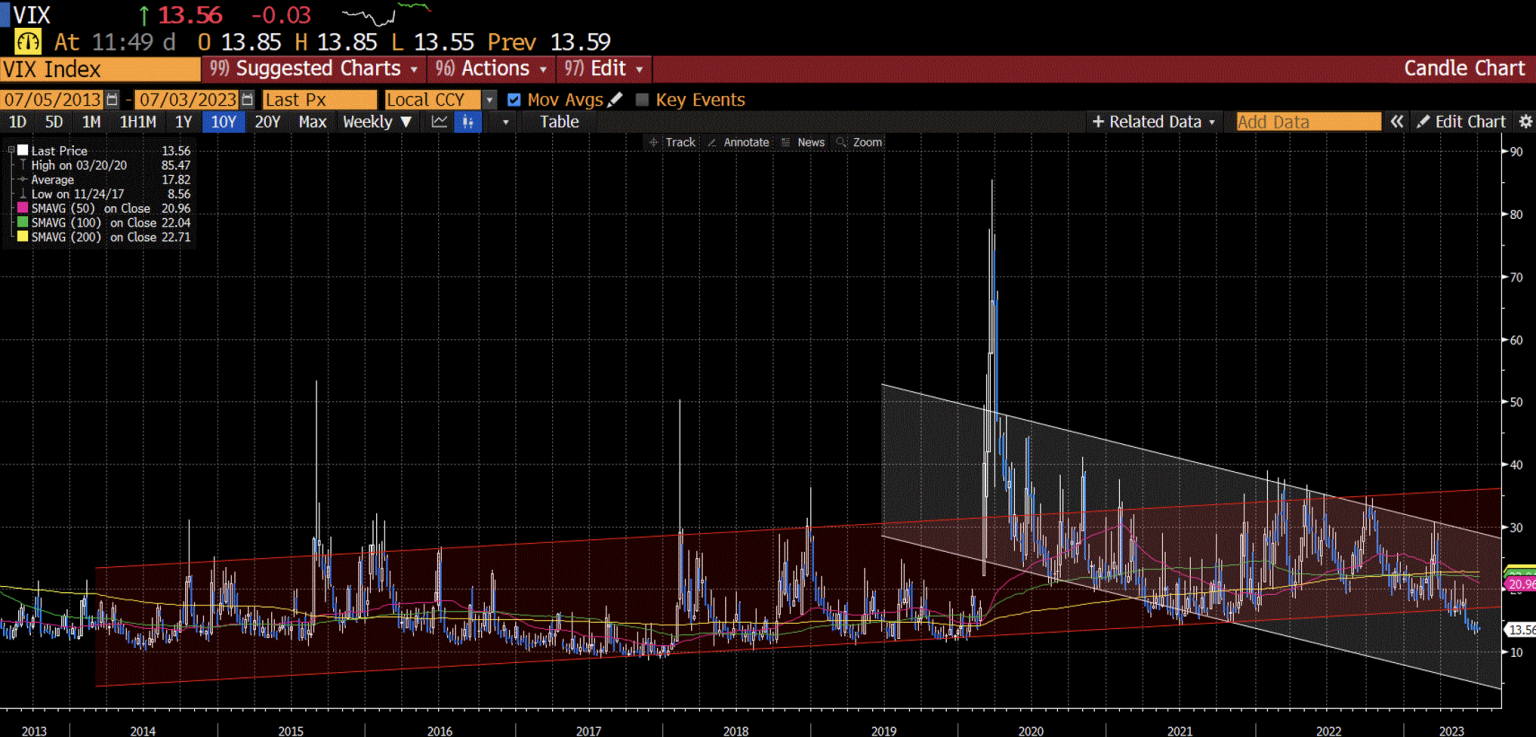
With the Fed aggressively raising rates and out publicly messaging almost daily from mid-year on, 2022 was a year of volatility. In late 2021, our team had messaged that investors should expect much higher realized volatility in 2022. We got that and some. Heading into 2023, we messaged that volatility was heading lower and a tailwind for stocks in the first half of 2023. We did not buy into the messaging of others of a “volatility regime change” to higher volatility for years to come. The spot Vix Index, albeit not a great stock predictor, has dropped from 32.5-34 in late 2nd and 3rdquarters of 2022 to 13.5-14.5 currently.
Opposite to how we entered 2023, bullishly, with most sell side strategists bearish on outcomes for 2023 and investors with their highest weightings in cash in decades, many strategists have now joined the bull chorus and dramatically raised their forecasts. Likewise, individual investor sentiment has come off the mat and is now rising. Not a bearish indicator but a lagging one at that. Should one be as optimistic at 4450 on the S&P 500 for percentage returns as they were 6 months ago at 3800? Certainly not. Particularly in the short term measured in 2-4 months. Summers, and particularly the 3rd quarters, have historically been difficult ones in the markets whether it be a 3rd year election cycle or otherwise.
Even in secular bull markets, major stock indexes have tended to decline 3-5% over a 2-month period during summers. This is particularly common once investors reach their 12-month long-term gain holding period. If you bought the first summer market low in mid-June 2022, you are now sitting in the long-term capital gains category. With this stock sales tend to increase as investors feel easier about locking in gains and paying some taxes. Unfortunately, during summer, liquidity is increasingly low and increased selling can cause quick air-pockets in the markets. Stock market volatility, both realized on your trading screen, or crossing your TV screen, and implied in the options market, is likely to rise for a while this summer as investor anxiety does once again. This would say that backfilling 200-250 S&P 500 points at any time between now and Mid-October is possible.
This would take us back down to the levels that many investors got jittery in August 2022 after Fed Chairman Jerome Powell’s Jackson Hole speech. Let’s call it 4175-4225 on the cash S&P 500. Or roundtripping back to the end of Aprils levels. That would be three steps forward and one back on the year. What might the likely causes for such a down move be or one’s investors might hear on TV for such a normal corrective pullback? Here’s a few our team came up with.
- A seasonal resumption of higher inflation after the July data is released.
- A renewed hawkish sounding Fed talking more interest rate hikes. They watch lagging data.
- Renewed US/China trade tensions stemming from an accelerated technology trade war.
- Weaker consumer data hitting in summer as the Covid savings buffer dwindles.
- Mid-year forward 2024 revenue and EPS cuts across a swath of industries as management team sound a cautious tone.
- https://www.youtube.com/watch?v=JFvujknrBuE
But investors should not fret if returns over the next few months are tempered or even down shorter term as we expect. Why? because history says that after a strong first half expect a stronger than normal 2nd half, with previously mentioned expected pullbacks being buying opportunities. According to Merrill Lynch, after above average 1st half returns, the S&P 500 is up an average of +6.5% (8.3% median), 77% of the time. This would equate to about 4730 (4800 S&P 500) into year end 2023, approaching the all-time highs of November through December 2021.
More historic data from Merrill. After a down year like 2022, and a strong first half like we had in 2023, Merrill found that the S&P500 was up 86% of the time in the second half of the year with an average return of +11.1% (11.5% median) which would equate to over 4900 into year-end 2023 as latecomers chase the rally and put cash to work. This target seems like a stretch to our team for the remainder of 2023.
Yes, we have heard time and time again over the last few years from many prospects who seemed glued to their favorite financial news channels watching economists or strategists who have never managed a dime of money, or worse many investors fearfully reading their $99 per year newsletter subscriptions written by non-fiduciaries with strings of diplomas and impressive credentials except the ones that matter most, have they ever managed money and do they know your financial situation. “This is unprecedented”. “It’s different this time”! And most of the time, it isn’t, as the day, week, month, and year may change, but behavioral finance rarely does.
At the end of this outlook piece, we have reposted some of the data and statistics we previously gave over the last 9 months, against the almost nonstop negative chorus investors heard throughout the financial press on CNBC, Bloomberg, and Fox news to support our 1st half 2023 positive outlook. Over the last few quarters, in advance of and during the markets rally, our investment team covered many topics including historic stock returns during Presidential election cycles, “golden cross” chart patterns, interest rate and inflation cycles, volatility (both stock and bond market) cycles, market breadth cycles, and currency cycles. It’s worth a review of this data when you have time. It’s the type of data our team relies on when the financial media is making the world out to be emotional, usually in a negative way.
For now, our team expects the gains we expected and have seen in the first half to slow and likely reverse and give back some of the year-to-date gains over the next few months in a very normal fashion. Our volatility model and history both point to a pullback in the 4-5% range. This pullback could then be followed by a decent yearend rally measured in percentage terms toward, but just short of new all-time highs, call it 4725. Here’s a visual representation of how that might look on a weekly chart of the S&P500. While moves down in the markets almost always feel uncomfortable to investors, this type of pattern would be quite normal to develop in the coming months. Much as the move up has been, against the backdrop of most calling it “unprecedented” or at least “unwarranted”.
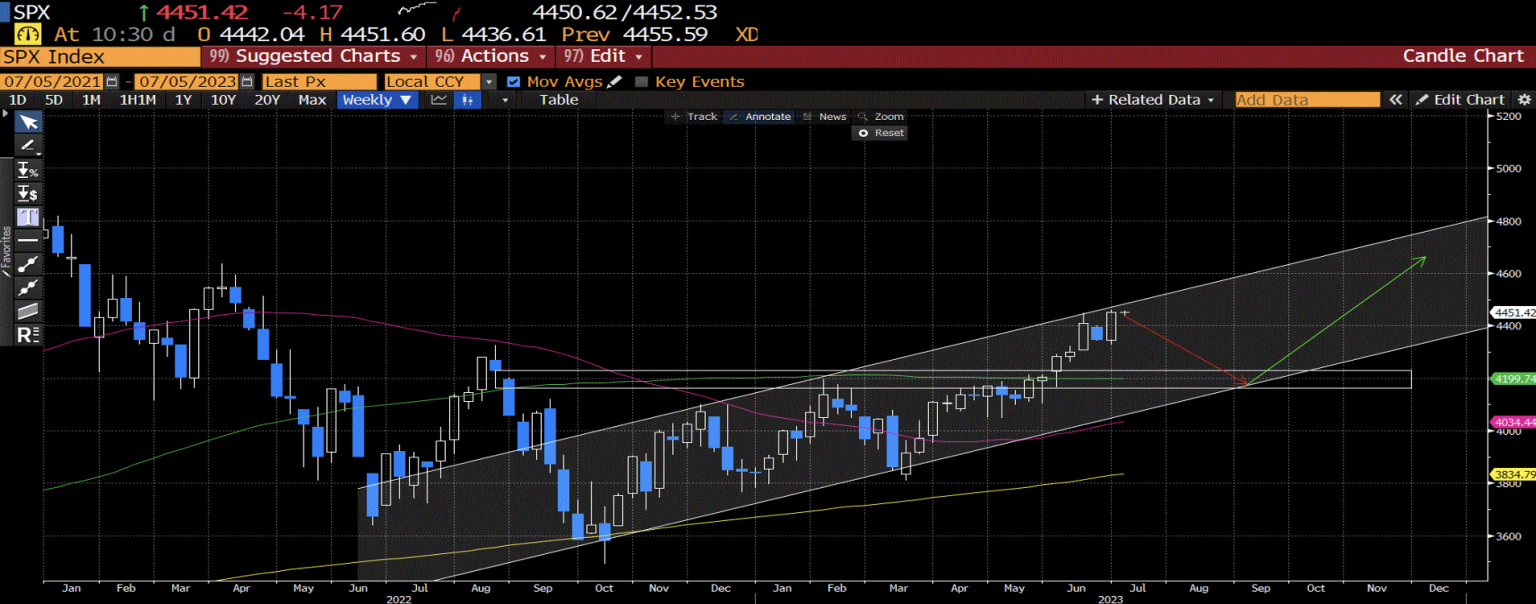
A move lower from here, before extending the 2023 rally would be quite a normal outcome.
With the volatility that both stocks and bonds in the public financial markets experienced in the first 9 months of 2022, and now with realized volatility much lower, and the markets calmer, our investment team recommends that you get on the phone and give our Oak Harvest team a call and ask to speak to one of our financial advisors and planners. When your fear has subsided and you are emotionally more balanced, that’s the time to set up a meeting and sit down with our team, that’s the time to review your allocation and see if it can meet your needs in retirement. Or maybe now, when markets are up and recovered and volatility is low, that’s the right time to dial it back and get back from being out over your skis. Give us a call at ——– and give our whole team a chance to help you with your retirement allocation and have our financial planning team model your cash needs and maybe a few of your greed’s too into and through your retirement years. From myself, Troy and Jessica and the rest of our growing Oak Harvest team, we are here to help you. Have a blessed week and a fantastic summer.
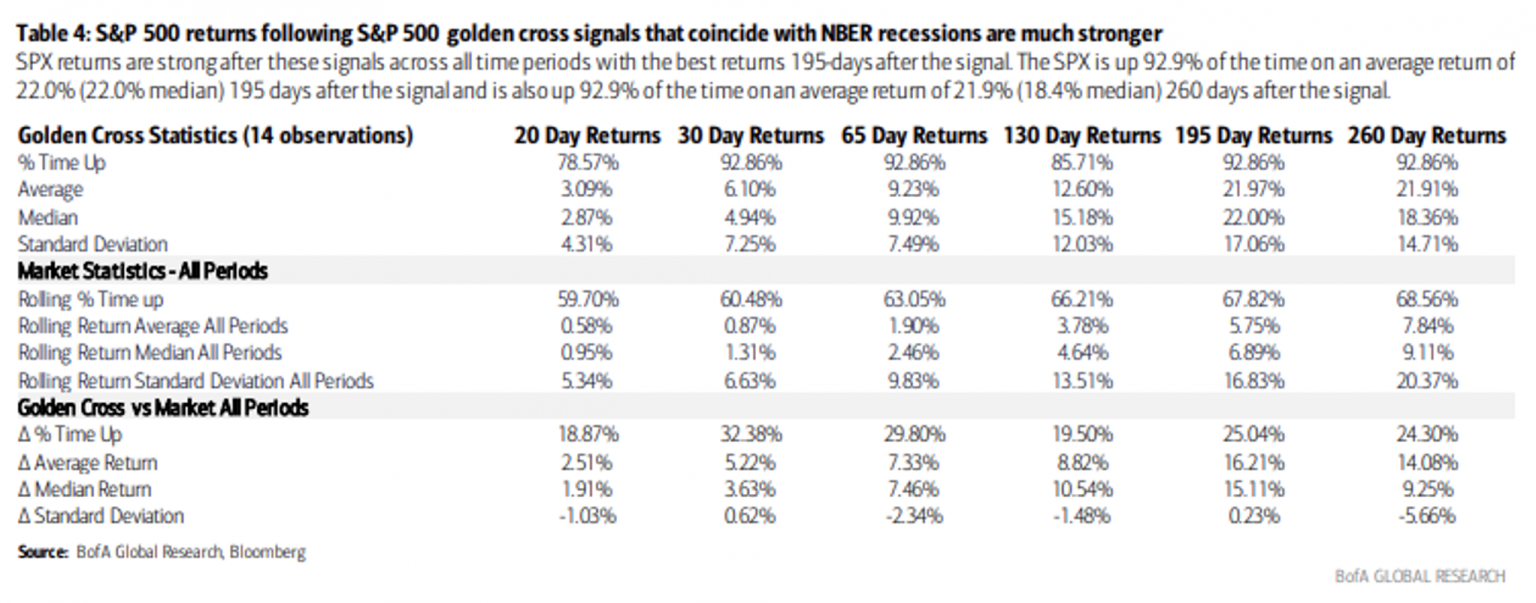
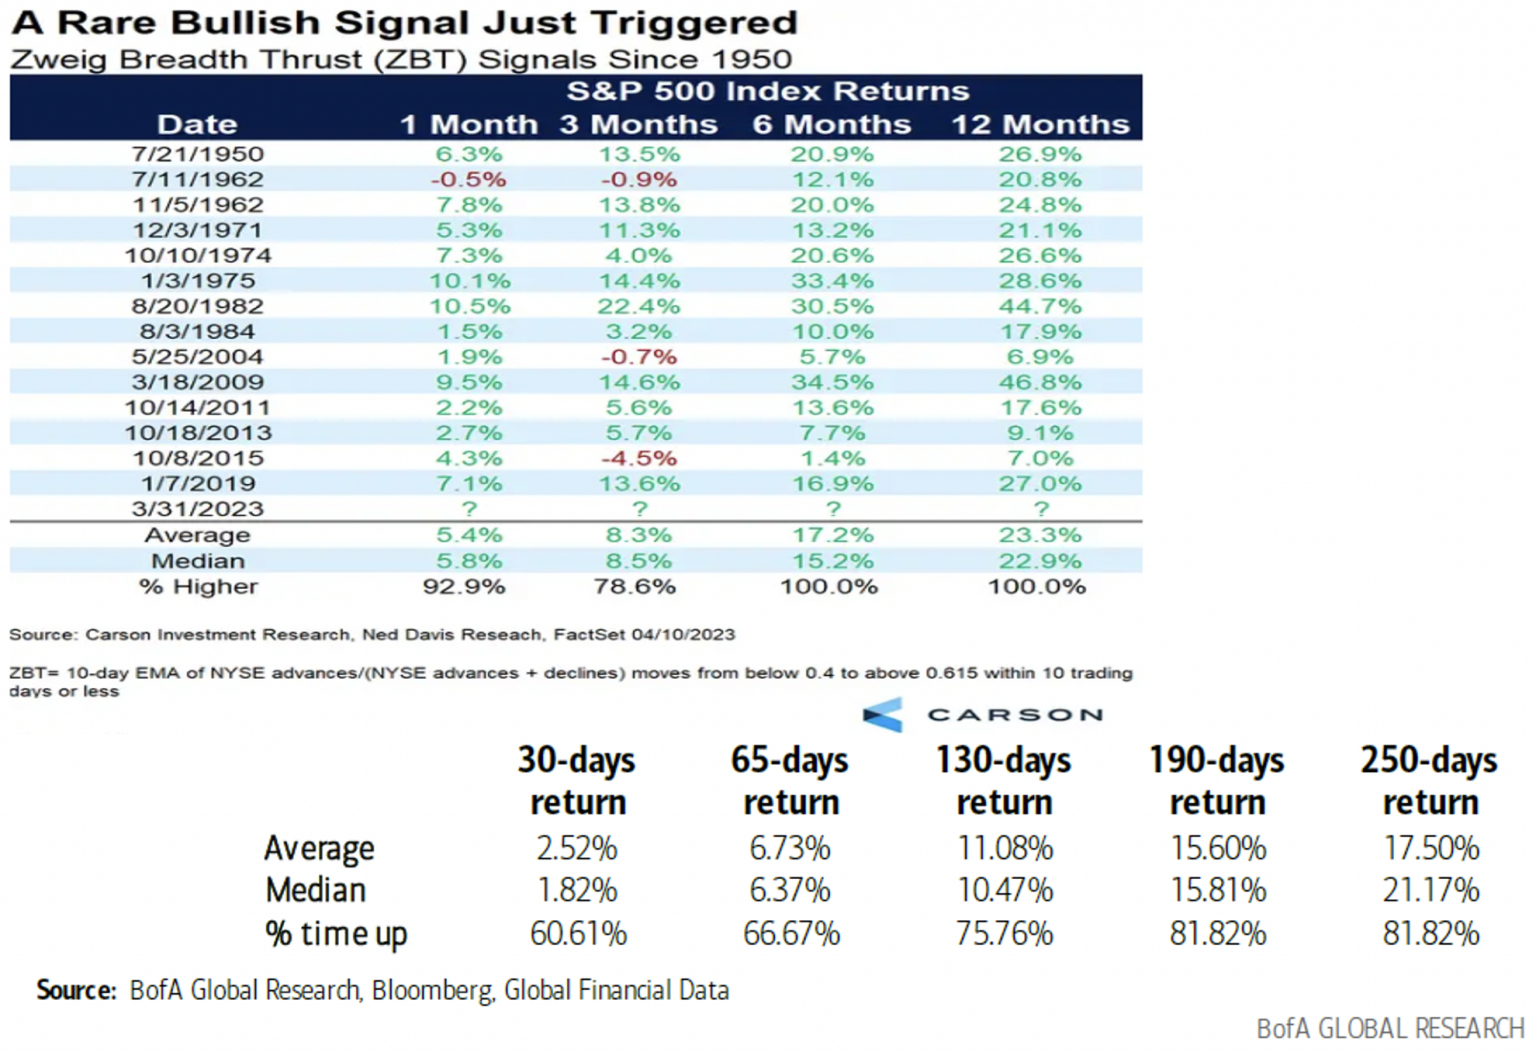
According to Merrill Lynch, over the 34-prior occurrence since 1930, the S&P 500 has traded higher 82% of the time over the next 250 trading days with an average return of +17.5% and a median return of +21.2%. Here is the summary for those 34 occasions.

Chris Perras
CFA®, CLU®, ChFC®
Chief Investment Officer, Financial Advisor
Chris is a seasoned investment professional with over 25 years of experience working with some of the most successful money management firms in the world. Chris has made it a point in his career to adapt as the market landscape changes, seeking to utilize the appropriate investment strategy for a given market environment. His transition from managing billions of dollars at the institutional level to helping individuals and families retire is guided by a desire to see first-hand the impact he is making in the lives of clients at Oak Harvest.
Click to subscribe: