
First Half of 2023 Market Outlook Part 2 | Stock Talk Podcast
STOCK TALK HAS BEEN MOVED TO ITS OWN CHANNEL! CLICK HERE TO VISIT: https://www.youtube.com/@OakHarvestStockTalk
Continuing On:
I am Chris Perras, Chief Investment Officer at Oak Harvest Financial Group, we are a retirement planning and investment management advisor located in Houston Texas. Welcome to the part two of our 1st half 2023 market outlook. Recall, we titled it the “Old Normal”.
Why? Because after close to 12 years of generous Federal Reserve monetary policies brought on by the Great Financial Crisis in 2008 and 2009, Central Banks around the world are reverting to their old ways of allowing business cycles, both good and bad, to play themselves out.
As for the public financial markets for the first half of 2023, let’s start with fixed income and bonds. After 10 years of suppressing yields through QE, Quantitative Easing, the Fed has once again reversed course and is selling bonds and letting their balance sheet shrink. Here’s a chart from Bianco Research of how historically bad 2022 was versus other years for global bond returns.
Down -16.4% on the Bloomberg global bond index. It was a horrific year for most bond markets. That’s over three times worse than the -5.2% return in 1999, which was the second worse return the last 30 years.
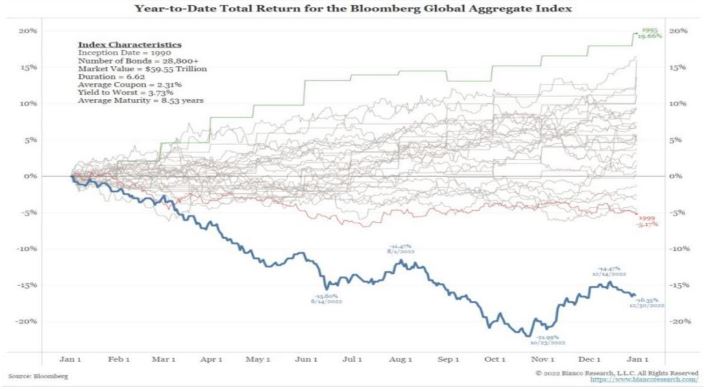
The good news is that expected returns increase from lower price levels and the chart for 2022, the lower bold line, looks like it’s starting to form a reverse head and shoulder bottoming pattern in this amateur chartist’s opinion. Many public fixed income investments are looking attractive to the OHFG team for the first time in years. With yields haven risen dramatically in 2022, bond yields are now offering fixed income investors and retirees decent yields for income generation.
Shorter term government bonds, Investment grade credit, and municipal bonds look very attractive now as all should hold up better in either a first half 2023 economic slowdown, or a Fed induced recession.
Inflation should continue dropping throughout the first half of 2023, but it is likely to remain above the Feds 2% goal due to demographic factors. While longer term gove
duration and maturity shorter in government bonds still makes sense to us given the likelihood of on-going volatility in government bond markets in the first half of 2023.
When contemplating asset allocation strategies including both stocks and bonds, we messaged our thoughts on the standard 60/40 portfolio a few weeks ago in our YouTube video titled “60/40 portfolio, Don’t Give up, Jim Valvano”.
Having had its worst annual performance since 1937, this blended stocks and bonds strategy has been dramatically repriced in 2022 and looks to be a better longer-term strategy now to an even wider audience, not just those worried about income in retirement. Here’s the link to that video. https://www.youtube.com/watch?v=t2I3Q3SaYto&list=PLxj0FBH5Bt8twiZx9RvxpW9AydohZ5W3-&index=1
The video is filled with some great historical stats. I know its self-serving but check it out, I think you’ll like that content.
As for equities in the first half of 2023? What’s our Oak Harvest team thinking? Bluntly, it’s up to the Federal Reserve. First, here’s a chart of the S&P500. Playing amateur chartist like everyone else on TV now days, this is an ugly chart in general. A chart of a 1-year bear market since the Fed flipped more hawkishly in late November 2021. Down and too the right. Failing at its uptrend on multiple occasions. Generally ugly.
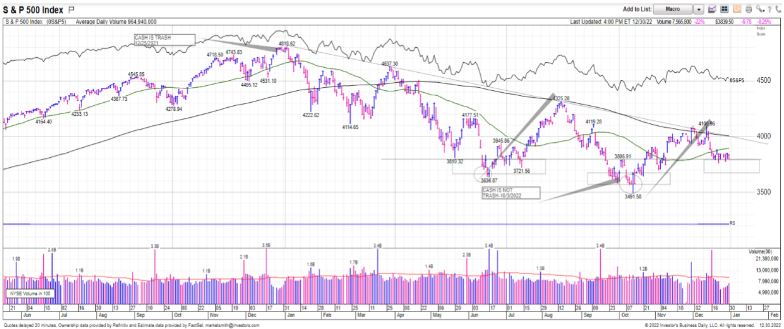
To get bullish, chartists want to see a daily, weekly, and/or monthly close above the downtrend. That downtrend now sits around 4000 on the daily, which coincidentally is close to the 200-day moving average, call it 3985ish on the weekly, the 40-week moving average and 4030 on the monthly chart, the 20-month moving average. Optimistically speaking, one could say, much like the bond chart, the S&P500 daily chart is trying to form a reverse head and shoulder bottoming pattern around the 3800-region represented by the rectangle outlines on the chart. Unfortunately, it looks like it could be another 4 to 8
weeks to see that play out if it’s the case. Daily, weekly, and monthly closes above those downtrend levels, and particularly above cash S&P500 4100, would look to project to 4300 sometime in the first half according to chart technicians our team follows.
But at the end of the day, through January, the first quarter and the first half of 2023, it’s still up to the Federal Reserve and them controlling the real interest rate component of bonds. We’ve previously discussed this one. Since late December of 2021, real interest rates have risen in anticipation of the Fed fighting inflation. Their actions have worked in the goods sector. Shipping costs have collapsed. Used car prices have tanked. Closer to home, literally, the housing markets have softened materially. Much higher mortgage rates weakened consumer demand in housing in 2022 and caused a rapid falloff in consumer discretionary spending for furniture and other consumer durables.
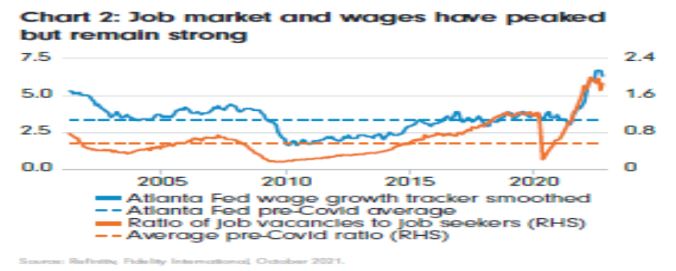
However, the Fed’s actions have been transmitted more slowly to the service sector where businesses hate firing trained employees. But now even the jobs and wage markets are past peak inflation. Here’s a graph from Fidelity showing that the our service economy is past its peak for the cycle.
For now, our Fed is publicly messaging that they will be raising rates significantly beyond the neutral level into the restrictive territory and keeping them there to bring service inflation down in 2023. If they continue this aggressive path, the economy and stocks will struggle in the first half of 2023. Given their track record, particularly into year-end 2021, I’m not so certain the Fed will reach its current goal of raising rates into the 5.25% range.
Why? Because there are some indications the Fed wants to slow down before blowing things up in the economy and financial markets. At the December meeting, much as they did in December 2021, behind the scenes, the committee was not in full agreement with Chairmen Powell and his own public views. Most recently, the FOMC discussed the variability and lag effect of their prior actions. For the first time in 2022, FOMC members talked about slowing down rate increases to see what was going to happen due to their prior moves in 2022.
A slower Fed, post their early February meeting, would finally be a tailwind for the markets in the first half 2023.
The US dollar was a massive headwind for the revenue and earnings of the large-cap stock indexes in the US in 2022. Here’s a chart of the DXY index which is the US dollar versus a broad basket of other international currencies.
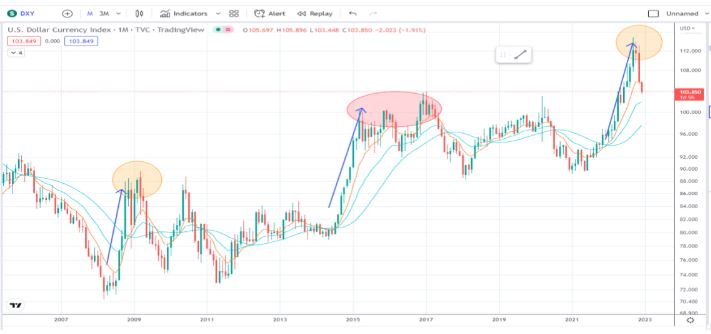
Over the last 15 years, in 2008, during the 2nd half of 2014 through 2016, and during all of 2022 were periods of a stronger trending US dollar. Over these times, the S&P500 was flat at best and at worst showed substantial declines in 2008 and 2022. The dollar looks to have completed its strong run-in early October of 2022, not coincidentally at almost the same time the S&P500 found its 2022 lows.
A weaker trending US dollar in 2023 would be another welcome tailwind for large cap US equities that have multinational operations.
With the Fed aggressively raising rates and out publicly messaging almost daily from mid-year on, 2022 was a year of volatility. In late 2021, our team had messaged that investors should expect much higher realized volatility in 2022. We got that and some. The whole year ended with higher volatility than most expected, including our team. The bad news? According to Matt Cerminaro, there have been only 3 years since 1970, (so yes, we are including the high inflation period of the 70’s in the data set), with as many down -1% or more days as we had in 2022. Those years were 1974 with 67 down days greater than -1%; 2002 with 73 days, and 2008 with 75 days. These were all years or near years with bad and negative returns for a 60/40 portfolio.
The good news? After dismal returns in those years, the following years returns were all over +20%. The S&P500 returned +32% in 1975, a period of still high inflation, +26% in 2003 coming out of the Dot.com bubble collapse, and +23% in 2009 coming out of the Great Financial crisis. That’s reason for some optimism for the whole of 2023.
Opposite to how we closed out 2021 and entered 2022, we exit 2022 and enter 2023 with most sell side strategists now pretty bearish on outcomes for 2023 and investors with their highest weightings in cash in decades. Many strategist forecasts cite earnings estimate revisions for their pessimism. While earnings growth is certainly a major factor in the long-term return of equities, stocks are discounting
mechanisms and most often move ahead of analyst earnings forecasts. The max positive earnings revisions for the S&P500 were mid first quarter 2021. The S&P500 went on to gain over +30% from that point into its late 2022 peak as earnings revision momentum had peaked and were declining rapidly. Here’s a great chart from J.P. Morgan Asset management showing the anticipatory nature of global stocks versus earnings revisions. It shows, at extremes, earnings estimate revisions are a lagging, not leading indicator.
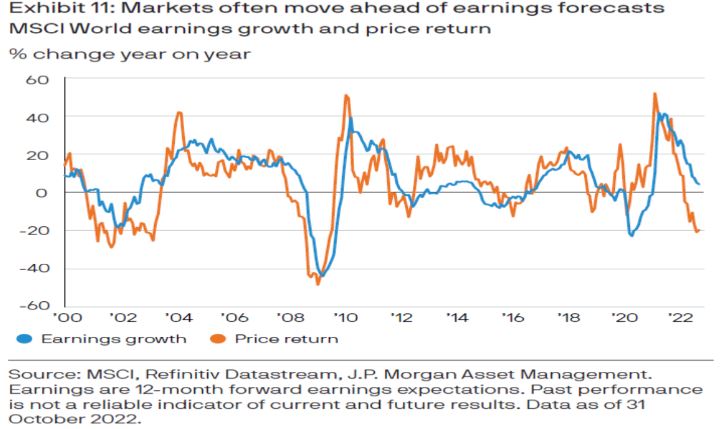
With the -20% price decline in the S&P500 year to date and almost -35% decline in the tech heavy Nasdaq, the US stock markets have likely already factored in news worse than consensus sell-side analysts are forecasting.
As 2022 concludes, first half of 2023 brings us closer to the end of the Fed tightening cycle that started last March. The markets are planning for at least 3 more hikes in the first half of 2023. So, unless the Fed watched service components of the CPI surprise to the downside, it will likely remain a volatility laden first quarter for both stocks and bonds to begin the year. However, historically, the conclusion of Fed hiking cycles have been tailwinds for the markets when the Fed is finished. Although the Indexes declined further following the completion of the 2000 Fed tightening cycle, the other 3 cycles the last 30 years were followed by gains in the S&P500 of a low of about 12% in 2006 to a high of over 24% in 1995 over the next 9 months. As we stated early in the piece, its up to the Fed and up to their effect on real interest rates.
However, I have to say this. Opposite our first half 2022 outlook where with markets near all-time highs we urged caution, highlighted increased volatility, forecast our first correction in years, and titled our piece “Curb your Enthusiasm”, the beginning of 2023 feels like we should swim against the tide a be more optimistic for the first half of 2023 than the herd.
Don’t get me wrong, we continue to expect a higher-than-normal level of realized volatility throughout much of the first half of 2023, however we are also acutely aware of the long-term stats of our economy and the stock markets, and where we stand at the beginning of 2023. We stand 180 degrees opposite how we closed out 2022. Viewers, remember, recession or not in the first half of 2023, stock markets usually start their recovery long before the NBER, National Bureau of Economic Research, declares the recession over. History shows that the stock markets start to recover about 6 months before both our industrial production and the US economy hit their troughs. Here’s a great chart from Capital Research Group showing the lead and lag affect of the markets and our economy.
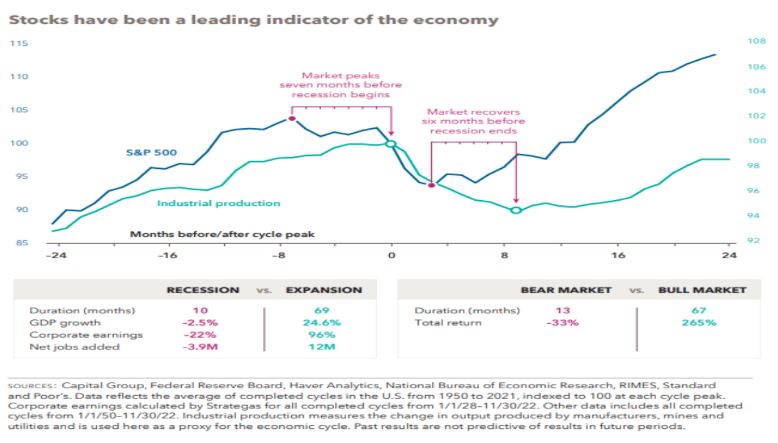
Investing in equity markets is about time in the markets with time horizons being measured in years, not days, weeks, or months. The long-term stats are worth repeating. The average bear market lasts 13 months, a little longer than a year with an average decline of about -33%. Our S&P500 peaked almost exactly 12 months ago, and at our 2022 summer lows, it had declined about -27.5%. No doubt, 2022 was a horrible year for the overall market. However, ultimately, bear markets and recessions end. Historically, on the other side of the trough, the markets long term rewards have far outweighed the negative experience of shorter-term downturns. Since 1950, the average bull market lasted 67 months or nearly five and a half years and returned about +265%. That some compounding power.
Investing in the stock markets is a humbling experience and 2022 reminded many older, experienced investors like myself, and taught many new ones, just how unpredictable the market can be from year to year. Our team expects the markets to continue to be volatile in the first half of 2023 but at a declining rate versus 2022. As the year progresses, both the stock and bond markets should begin looking through the 2022 actions of our Federal Reserve and other Central banks and the economic slowdown they are causing, factoring in variables such as higher real interest rates, slowing inflation, and reduced 2023 earnings estimates. Markets and investors should begin looking through the valley toward the other
side where companies marginal return on capital troughs, and capital investment begins to improve. Let’s call 4300 an optimistic initial target for the S&P 500 sometime in the first half of 2023 if the Fed slows its pace and the markets can exhale and look across the valley.
With the volatility that both stocks and bonds in the public financial markets experienced in 2022, our investment team recommends that you get on the phone and give our Oak Harvest team a call and ask to speak to one of our financial advisors and planners. Set up a meeting and sit down with our team and let us walk you through how the sequence of returns can affect your retirement plan every bit or more than the average investment return your current advisor is generating you. Give us a call at ——– and give our whole team a chance to help you with your retirement allocation and have our financial planning team model your cash needs and maybe a few of your greed’s too into and through your retirement years. From myself, Troy and Jessica and the rest of our growing Oak Harvest team, we are here to help you. Have a blessed week and a fantastic new year.

Chris Perras
CFA®, CLU®, ChFC®
Chief Investment Officer, Financial Advisor
Chris is a seasoned investment professional with over 25 years of experience working with some of the most successful money management firms in the world. Chris has made it a point in his career to adapt as the market landscape changes, seeking to utilize the appropriate investment strategy for a given market environment. His transition from managing billions of dollars at the institutional level to helping individuals and families retire is guided by a desire to see first-hand the impact he is making in the lives of clients at Oak Harvest.
Click to subscribe: