
Market Analysis: S&P 500=3600, Possible 2000’s Style Hard Landing and Recession? Scenario 2

Last week we recapped the first quarter 2024 returns, the S&P500’s best first-quarter performance since 2019. 1st quarter returns place it in the top 10 the last 54 years, and in the top 15 since the end of WW2. Investors, this is how stocks behave during a “soft landing” as we discussed back last October. We covered what the remainder of 2024 and 1q2025 might look like for stock markets under a continued soft-landing outcome like 1995. We called this scenario one or the next year. This the goldilocks run continuing. This is a run of 2-3% real growth and 2-3% inflation outcome. Not too hot not too cold. Recall in 1995, Alan Greenspan after much anticipation and waiting, hinted at interest rate cuts in June, but then only cut interest rates once in July during the year and the stock markets were steady eddy up until they finally retested its upward sloping 50-day mva in October, and then resuming its march higher throughout the end of 1995 and 1h96.
The second scenario I must present is quite the opposite outlook of “Goldilocks”. This is bearish Hard Landing outcome of the Federal Reserve holding rates too high for too long and causing a recession out 9 to 12 months from now. This is the hard landing scenario the stock markets and economy experienced post the Dot.Com run in the 1st quarter of 2000.
Having lived through and managed money during that time period, I cannot deny the similarities of many things going on in both our economy and stock markets now and then. Back then, I recall, and the data shows that the US consumer was strong into Xmas 1999 and Jan 2000, but then someone turned out the lights in many areas of consumer spending in February of 2000 and the rest of the first half and most retailing and consumer stocks were horrible stocks.
Homebuilding stocks hung in there for most of their part, but stocks like Nike and even MacDonalds fell out of bed in the 1h2000. We have seen very similar patterns this year to date.
Energy stocks along with semiconductor stocks and Dot.com infrastructure build out plays, such as Cisco and Cascade back then were huge market winners in 1q2000. We’ve seen almost identical leadership so far, this year with those previous cycle winners replaced by Supermicro and a few others. In the semi space everyone recalls the parabolic run in QCOM in the 1q2000 on the early buildout of the wireless internet and smart phone. This year’s big winner in the semi space NVDA, was also a huge stock back then. I’ve been posting the overlay of the semi space for well over a year, bullishly in late 3q2023 while many were talking crashes or bubbles. Clearly those calls were not just “too early” but wrong at that point in time.
Unfortunately, the Dot.com cycle did come to an end in 2000 due to excess speculation in tech stocks and massive overvaluation in many of that markets leaders. In fact, I can tell you exactly where I was standing the day tech stocks peaked in March of 2000. See back then the Fed was very aware of the speculative juices flowing in the markets and wanted to cool the markets in 2000, even though it was an election year. The economy and the stock market peaked in late 1q2000 and then did a lot of chopping around until mid-3rd quarter, late summer, when the economy succumbed to tighter financial conditions, the double and triple ordering in tech spending was front and center and the markets entered its normally weak, pre-Presidential election time. Here’s a daily chart of the S&P 500 in 2000 and into the 2nd quarter of 2001. Dot.com bubble popping, Pre Bush-Gore Presidential election controversy and then after both.
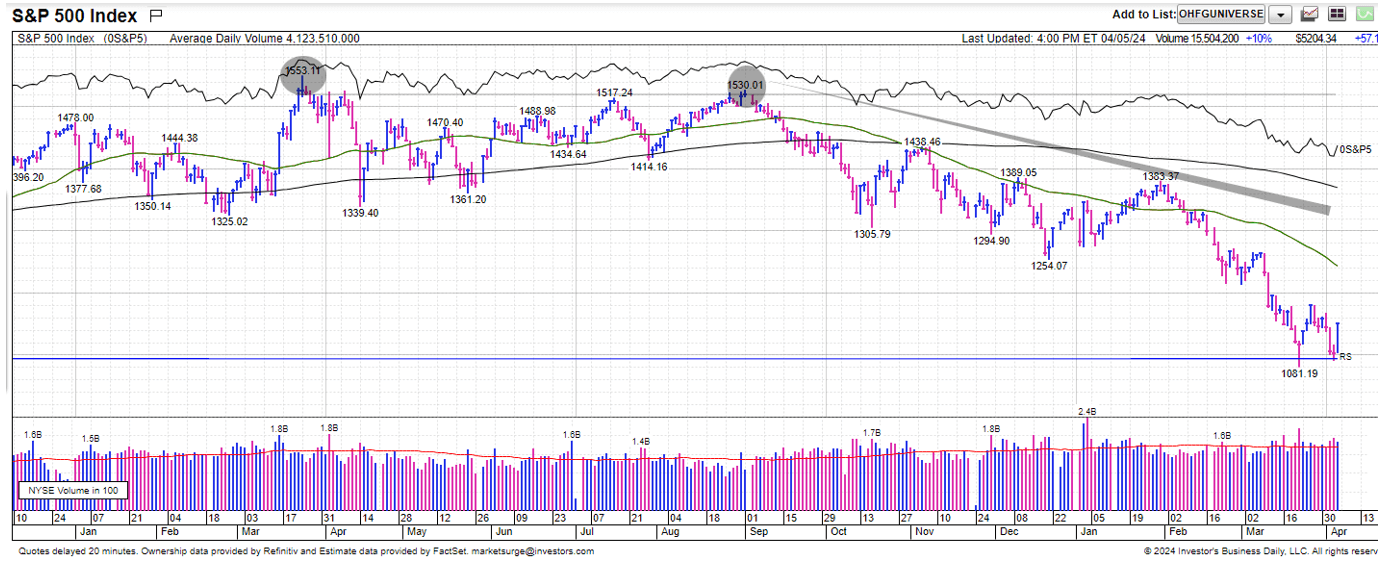
Here’s the weekly chart of the same time period.
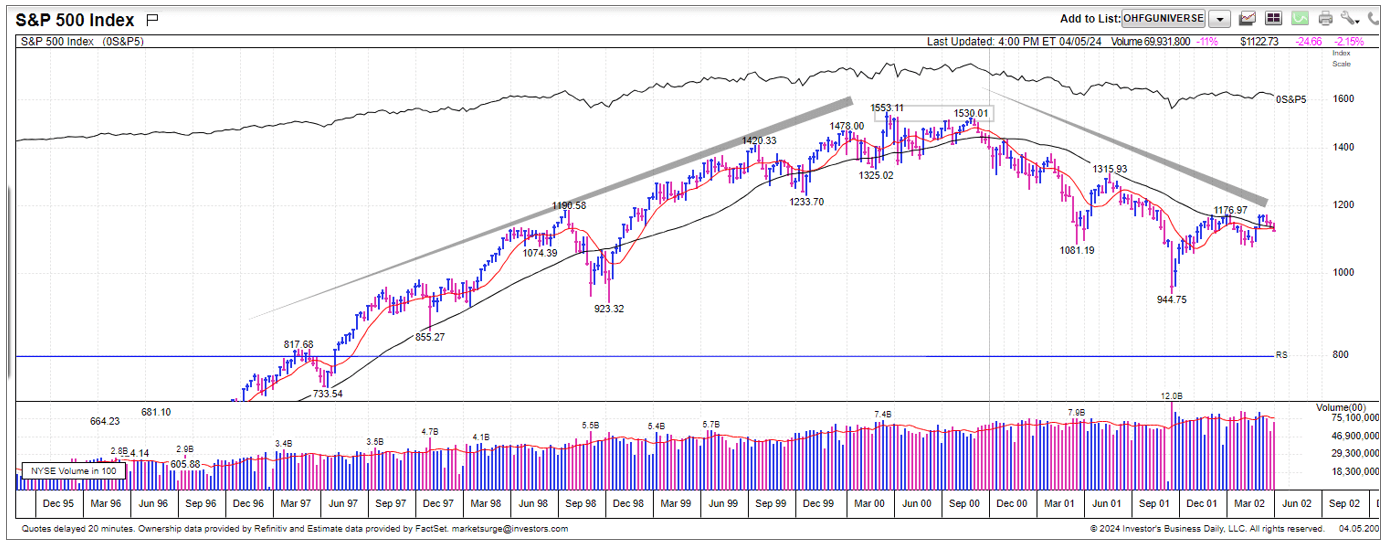
Investors, that’s what a bear market looks like most often. It usually doesn’t happen in one month. Like the Covid crash. It’s usually a series of lower high and lower lows cascading down over 9-12 months. And peak mid-March 2000 at 1553 in cash SP500 to the first low, in March 2001 almost exactly a year later at around 1081 is exactly what I tell investors to expect in a recession. What’s that? -30%. If you were lucky enough to sell the exact high, or unlucky enough to sell the short term low. -30% is what transpired almost to the first decimal. Yeap, that’s a very normal recession. Not a GFC recession, not a great depression recession, and not even a bubble collapse recession.
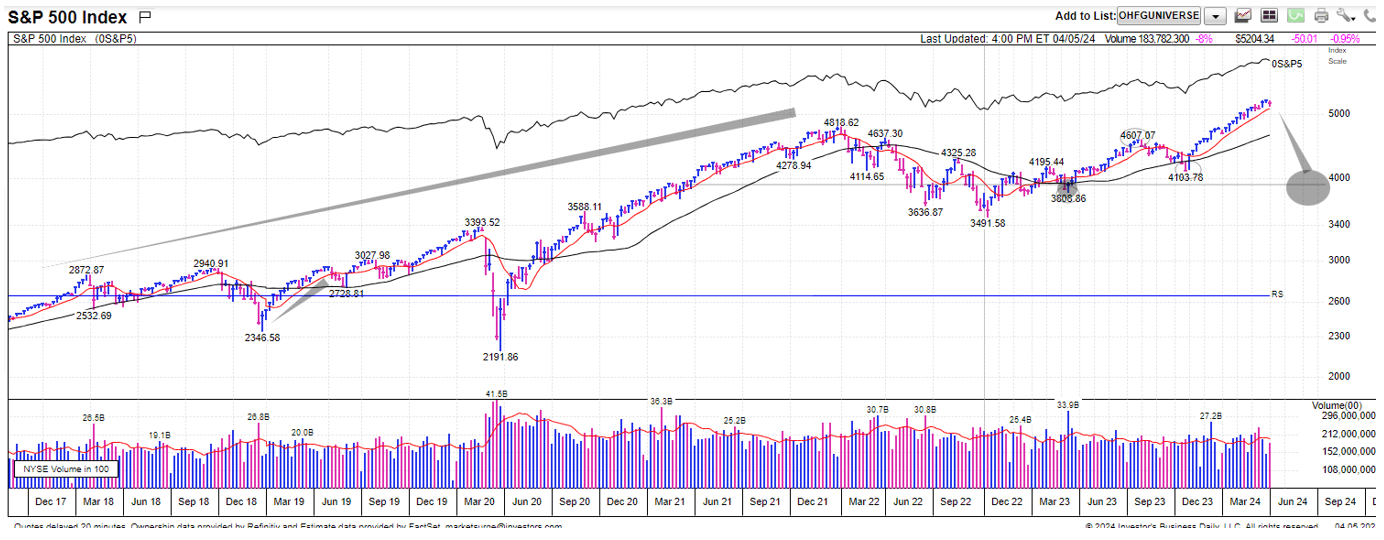
So, investors, Scenario 2, hard landing, normal recession repeat? What’s that S&P target on the downside given where we sit? Well -30% from here, which would equate to a 45+ volatility reading, triangulates too? 3650-3700.
Investors, this would be the bear market will begin in 2h2024 outcome. This is the economic hard-landing scenario for the rest of 2024. This is the higher volatility, sell the rips, it’s a secular bear-market market. This is the real growth rate slowdown we are seeing behind the scenes in the real time data, morphs into more than a slowdown in the 2h2024 just like it did in the 2h2000 post Dot.com buildout.
While this outcome would be very rare for a 4th year presidential cycle, as politicians are busy trying to win votes and the election by keeping the economy chugging along, it happened in 2000 and 2008 as well. This low index level volatility regime we are in most likely wont last another 1-2 years straight given the current weaker consumer economy in the US and foreign geopolitical turbulence. But there are currently few signs of an impending top and it does appear that the Fed may be watching real-time data, not just the horribly inaccurate government data releases.
Investors, that’s it for this week and our teams’ thoughts on a pessimistic scenario for the rest of 2024 and early 2025. Next week I’ll give you a bit of the same rundown in scenario 3 presenting what a muddling by scenario might look like.
Right now, our team doesn’t see the leading signs of a future recession this year but can say, that we will have one again in this decade, and recession in the stock market are a minimum of -30% down moves. Right now. That would equate to back down to 3600 -3700 on the S&P 500, back where we were in October of 2022 when we did experience an earnings recession in the market.
For investors or retirees uncomfortable with wider range of possible equity outcomes, the Oak Harvest team has launched a new strategy that retains the ability to go long stocks, short stocks, as well as buy partial hedges and shock absorber “insurance” for a stock portfolio. Information on this exciting new strategy of ours can be found at www.OakHarvestFunds.com. From the whole team here, thank you and have a great weekend.

Chris Perras
CFA®, CLU®, ChFC®
Chief Investment Officer, Financial Advisor
Chris is a seasoned investment professional with over 25 years of experience working with some of the most successful money management firms in the world. Chris has made it a point in his career to adapt as the market landscape changes, seeking to utilize the appropriate investment strategy for a given market environment. His transition from managing billions of dollars at the institutional level to helping individuals and families retire is guided by a desire to see first-hand the impact he is making in the lives of clients at Oak Harvest.
Click to subscribe: