
Bad breadth? Not so fast – Zweig Indicator Triggered Historically Rare & Positive

At the end of the first quarter, we title our March 31st video “Marching Higher into April”. In it we laid out 3 reasons we expected a continuation of the overall market upward movement into the mid-second quarter. The 3 reasons we laid out? First, the price charts, which merely reflect the supply and demand for an asset, looked higher. Second, market sentiment and investor risk appetite had gone from positive in late January to quickly becoming very poor at the end of February. This quick flip-flopping by investors is quite common at the start of upward moves. And finally, we once again discussed the positive historic seasonality of April and the second quarter in a 3rd year of a Presidential cycle.
A Quick Catchup
We are doing a quick catchup on where we stand now, titling this one “when a bear finds better breadth”. I am Chris Perras with Oak Harvest Financial Group in Houston, Texas and welcome to our weekly stock talk podcast, keeping you connected to your money.
Before we get into this week’s topic, please take a moment to click on the subscribe button and click on the notification bell so you will be alerted when our team uploads our latest content. We do have a new location for our Oak Harvest Investment oriented content. You can find it by typing “Stock Talk with Chris” in the Google search window or going to the Oak Harvest You Tube channel and clicking on the drop-down tab labelled “channels” and clicking on “Stock talk with Chris”.
Well viewers, the secular bear market crowd, who was very right for the first half of 2022, continue look to be very frustrated since the October 2022 lows and particularly in 2023. As of this taping, the S&P 500 was up —% year to date and the NASDAQ composite has rallied —%. Against the backdrop of bank failures, hawkish Federal reserve talk, increased China/Taiwan tensions, and overall negative news spin on the financial networks. Here’s a daily chart of the S&P500. Here’s a weekly chart.
These pictures are looking much more positive with each passing week. The S&P500’s dramatic downtrend was broken back to the upside in — and the markets have made a series of higher lows and higher highs. Is it a runaway train to the upside? No not at all, but you don’t want that if you are a bull. You want the pessimism to continue to grow even as the markets move higher.
Many strategists on TV have voiced bearish opinions with an argument that only a few stocks are rising and causing the averages to gain in 2023. Stocks like AAPL and Microsoft are causing oversized index gains. While mathematically it is true that a few large tech stocks that are weighted heavily in the S&P index are overcontributing to the index gains this year, this is always true when there are a few big companies making an index top heavy. When commodities and energy were big weights in the indexes into the GFC, names like XOM and CVX overcontributed.
Does The Market Have “Bad Breadth?”
I have to disagree with their premise that the market has “bad breadth”. In fact on 3/31, just as the first quarter ended, an incredibly rare but bullish stock market indicator flashed a buy signal for the first time since early 2019. This indicator wasn’t even triggered during the massive 2h2020 and 2021 rally that stocks had. According to Merrill Lynch, on 3/31 the NYSE triggered only its 34th “Zweig breadth thrust” since 1930, over 90 years and only the 14th time since 1950! We talked about this indicator back in the second quarter of 2020 as it was close to triggering but it didn’t.
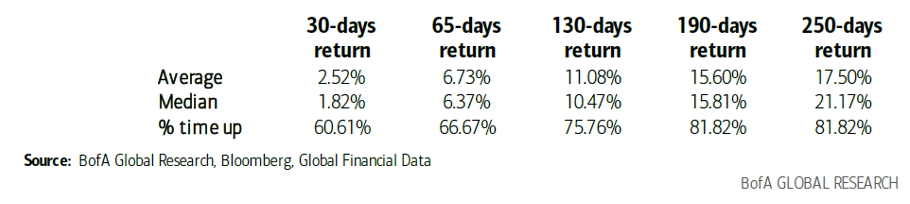
Here’s the historic data for this trading signal. Remember no guarantees in the stock markets going forward but this indicator has been historically very reliable and very positive.
According to Merrill Lynch, over the 34-prior occurrence since 1930, the S&P 500 has traded higher 82% of the time over the next 250 trading days with an average return of +17.5% and a median return of +21.2%. Here is the summary for those 34 occasions.
The indicator measures the broadness of the participation among individual issues in the broad NYSE index that contains over 3000 stocks. The indicator is calculated by taking a 10-day MVA of the number of advancing stocks divided by the number of advancing stocks plus the number of declining stocks. When that percentage goes from below 40% to above 60% in 10 days or less, the indicator is triggered. According to Carson Research, in the 14 times this has happened in the markets since 1950, the markets have been higher 100% of the time both 6 and 12 months later by a wide margin. No guarantees of course but here’s that data.
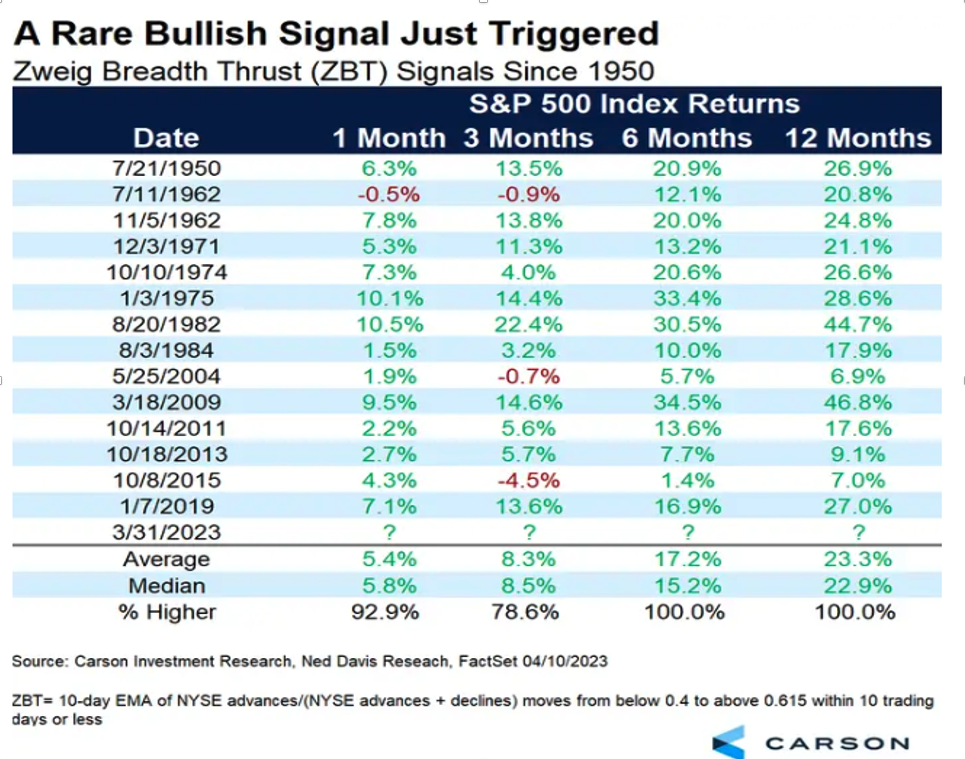
Looking at the lower right of this table, one will see that the average 6-month gain for the S&P 500 has been +17.2% and the average gain over 12 months has been over 20% at+ 23.3%.
While the markets did flash a number of breadth thrusts in 2022, none of them were the Zweig indicator which uniquely measures the speed at which breadth is expanding. Should this indicator once again prove prescient? Time will tell, but the rarity of it flashing buy and the magnitude of the forward price gains historically after it does, like it did on 3/31, argue that investors should be much less bearish in their attitudes and traders in their positioning for the coming 12 months.
We Can Help With Your Retirement Needs
Viewers, there is no perfect investment philosophy, there is no perfect trading tool, that is all weather, outperforming every stock cycle or in every economic environment.
At Oak Harvest, we have many tools that our advisors use to help our clients meet their retirement goals and objectives. These tools are both market based and insurance based, that we can use to meet your retirement goals. The future and stock markets are always uncertain and that is why our retirement planning teams plan for your retirement needs first, and your greed’s second.
Give us a call to speak to an advisor and let us help you craft a financial plan that helps you meet your retirement goals. Call us here at (877) 404-0177 and schedule an advisor consultation. We are here to help you on your financial journey into and through your retirement years.

Chris Perras
CFA®, CLU®, ChFC®
Chief Investment Officer, Financial Advisor
Chris is a seasoned investment professional with over 25 years of experience working with some of the most successful money management firms in the world. Chris has made it a point in his career to adapt as the market landscape changes, seeking to utilize the appropriate investment strategy for a given market environment. His transition from managing billions of dollars at the institutional level to helping individuals and families retire is guided by a desire to see first-hand the impact he is making in the lives of clients at Oak Harvest.
Click to subscribe: