
Presidential Election Cycles and Other Factors Affecting S&P 500 in the First Half of 2024

Frequent OHFG investment content consumers know, I love data and I study history of the stock markets and economic cycles, largely because the markets are a real time view into behavioral finance and investor emotions.
The 2024 market outlooks by strategists are out across the media outlets, and most of them read quite opposite of the negative herd that entered 2023. Many entered 2023 calling for recessions and or lower stock markets. From what I’ve seen, most strategists who missed the big rally in 2023 are now out talking much higher targets on the S&P. At least 5000 and some in the mid 5000’s already. The investment team at OHFG did not forecast a bad 2023 wayy back in Dec 2022. Many well know financial personalities called for investors to gorge on stocks at the 3000 .level or called for months for at least a retest of October 2022, 3500-3600 levels, as stocks rallied in the 1q2023! Of course, looking back, none of those events happened. No 3000. No retest. No October 1987 crash replay.
Our second half outlook for 2023 had a year end target on the S&P 500 of between 4730-4800, near ATH’s. Pretty much where we stand. Not only that, we called for the summer selloff in advance of that downdraft and also called the near exact timing for the October lows as well. Our 2h23 outlook was released back in July and called for “down then up”. Here’s the link to that content. Troy, Charles and I did a YouTube livestream on Thursday Oct 26th, here’s the link to that video.
Many market strategists who were absent or very late to the 2023 rally in stocks are now citing the “Presidential Election Cycle, year 4” as a big reason for their now bullish positions and much higher S&P 500 targets. Investors, I’m here to curb your enthusiasm for stocks here at year end, nearing all-time highs of 4730-4800, if your strategist is only now discussing this factor as a positive for stocks. 1h2024 Outlook Part 3: Presidential election cycles year 4, the Grinch that stole Xmas.
Viewers the Presidential Election cycle has been a real thing in markets for decades. It’s been a consistent winning strategy time and time again regardless of which political party is in control of the White House. Here’s the data summary as compiled by the quant team at Bofa/Merrill and Steve Suttmeier’s group.
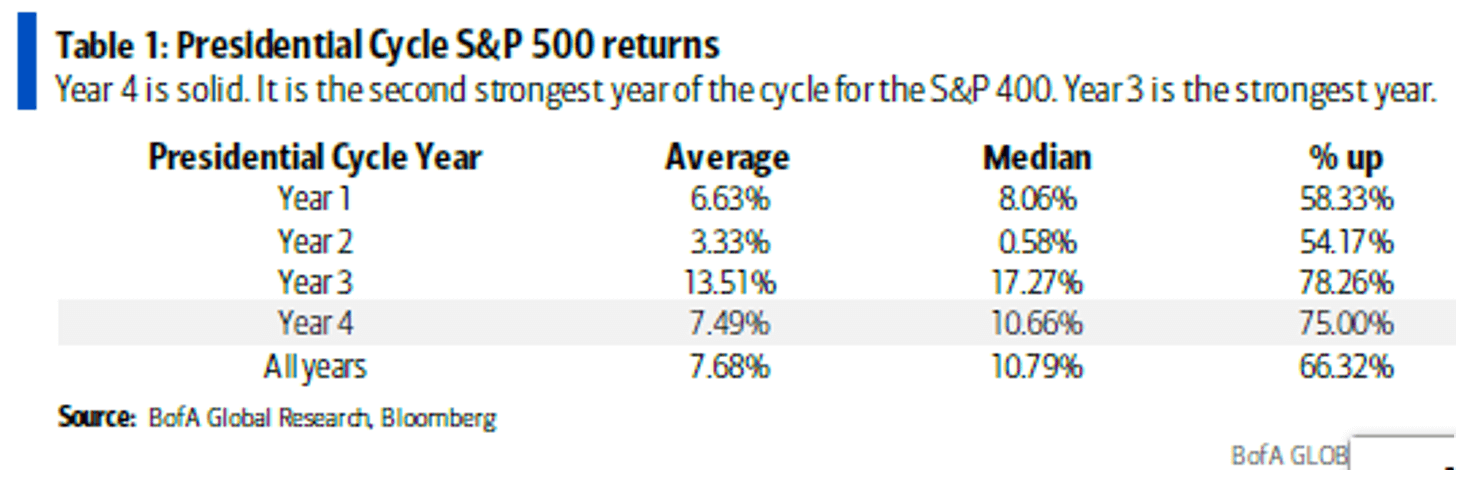
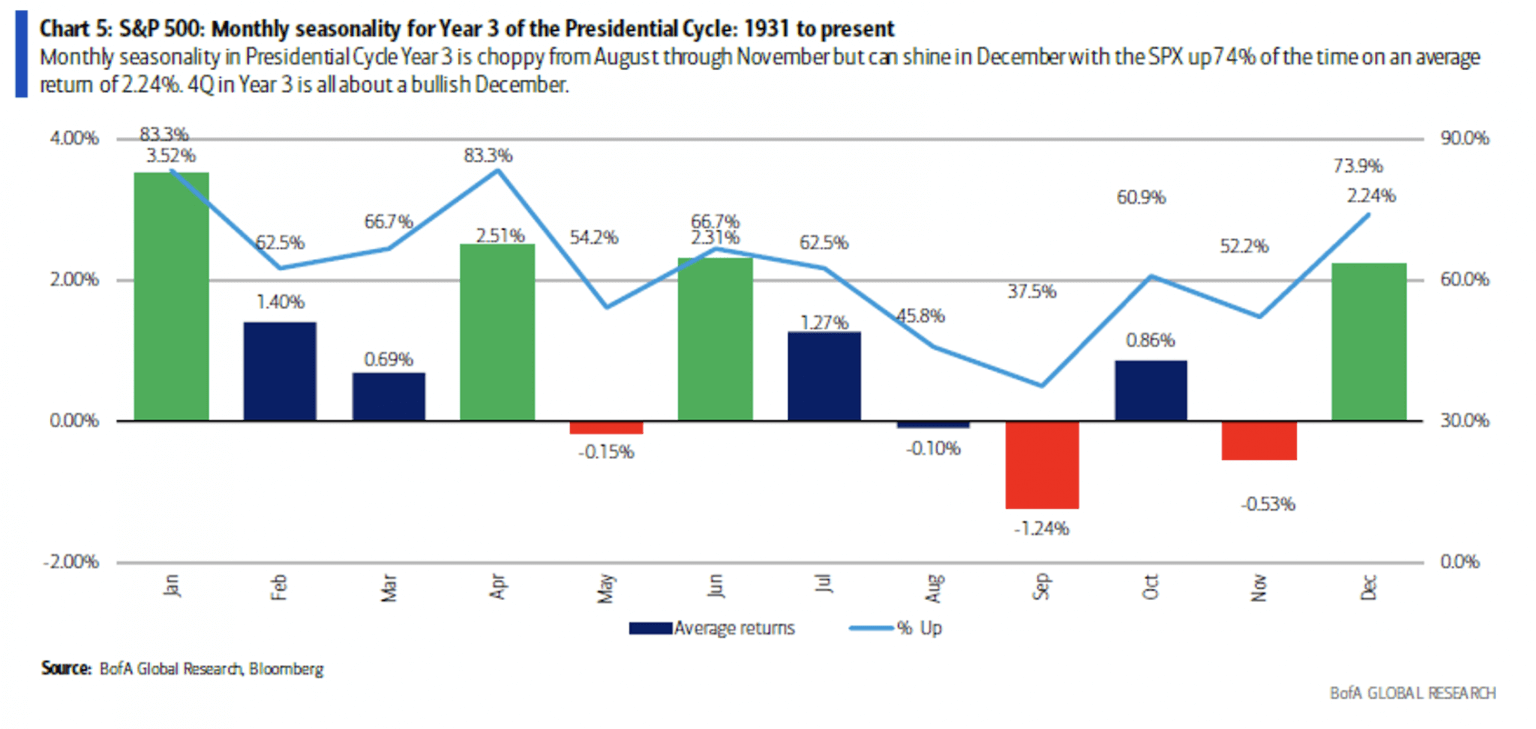
The data is the data and yes it does screen positive for 2024 based on the Presidential cycle. However, many strategists now touting it, failed to weigh this strategy in October 2022 when we first entered the sweet spot of the cycle, and in my opinion they are now weighing it too heavily in 2024 to back up their forecasts as they seem to trying to play catchup to the markets. Recall here is the monthly data for year 3, historically the most bullish, of the Presidential cycle.
I know only a couple strategists who strongly messaged this factor or pattern in late 2022 when the markets were on their lows as a positive for stocks 2023. Of those that did, I know even fewer who also messaged a summer pullback into October 2023 would create the big buy for a 4th quarter rally. FWIW, Oak Harvest one of these firms.
Unfortunately, while I do believe this will be somewhat helpful factor for stocks in 2024, I do NOT share others enthusiasm for how much the normal monthly pattern for year 4 will hold in 2024. Furthermore, as we exit 2023 near ATH’s, I can’t find this factor helping the markets exceed S&P 500 >5000 in the first half of the year. Hence, 1h2024 ode to REM, S&P 500 > 5000? Can’t get there from here. Here’s the monthly returns for every 4th Presidential year since 1928, along with the average and median returns in the lower table.
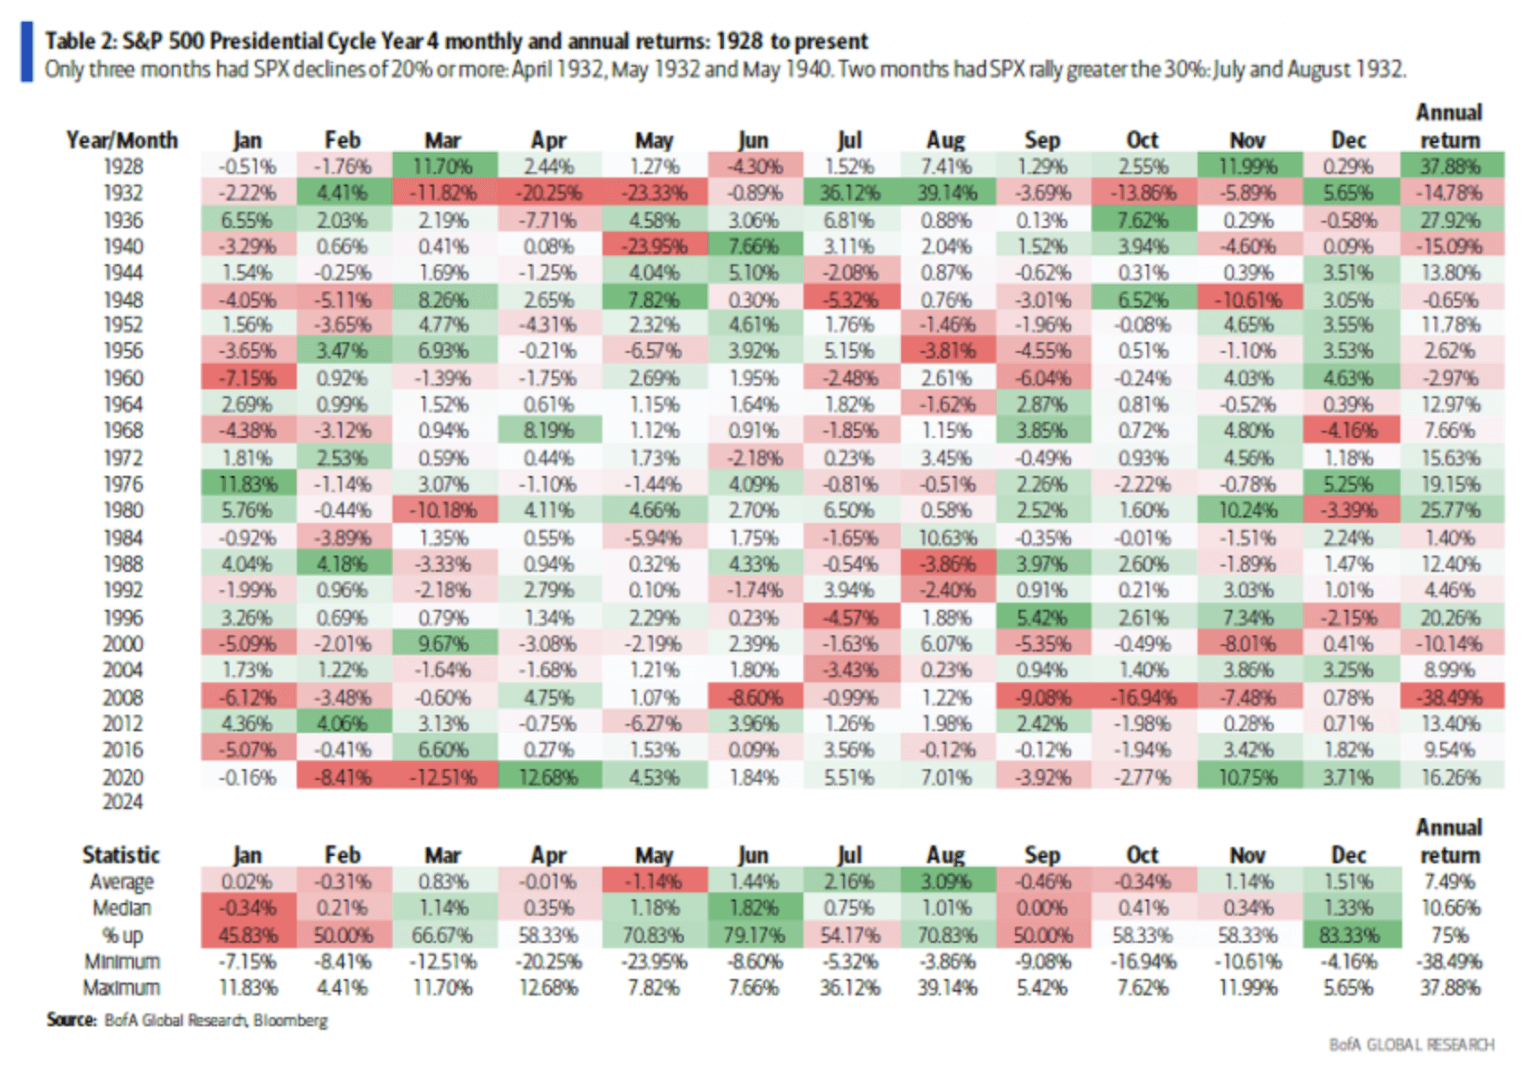
The average monthly return profile argues for the S&P 500 doing. Almost absolutely nothing net the first half of 2024. It equates to about .5% up for the first 6 months of 2024. The median monthly return profile argues for a 1h2024 of just about 4.5%. From current level ( UPDATE FOR FRIDAy) that would equate to? = at the end of the 2q24.
Unfortunately, when looking at the finer detail of the last 100 years, and comparing our current cycle that started in October 2022 to previous ones, my work continues say we our currently still mirroring a prior cycle that most investors would rather forget. October 1998 – March 2000 Internet, Dot.com bubble. In late 2023, Jerome Powell is talking quite similarly to Alan Greenspan in late 1999 did as both are trying to calm the bank markets for year end and give the banks better year end liquidity, and balance sheet mark to market positions. Should we continue to trade on top of this pattern, lets see in late January or late Feb 2024, should the markets fall 7-10% rapidly, which has happened early in the year many years, how many sell side strategists step up bullishly. Let’s see volatility doubles to the low to mid 20’s, how many strategists step up citing the Presidential cycle as a reason to buy the pullback or correction for a target of a new ATH in late first quarter or 2nd quarter 2024. Historically, most won’t. Most of the time you’ll find most strategists cut their targets in down markets and increase them in up markets. As of now, that’s not what the OHFG is planning on doing on any swift and sharp market move lower during the first half of the first quarter of 2024.
For now, our 1st half outlook for 2024 remains as it has been alluded to for almost a year. The first quarter of 2024 should usher in a year of heightened volatility. This volatility should present itself almost immediately in the first few weeks of the year and throughout the first half of 2024, that’s the bad news. The good news, new ATH’s in the S&P 500 are likely in the first half, most likely in late 1qt quarter and the S&P 500 can near 5000. That level is not “inconceivable” at all, just more of the “old normal” returning to the equity markets for 2024.
However, exceeding, and sustaining levels above 5000 on the cash S&P 500 for the first half of 2024? Well investors, sorry to say, “I can’t get there from here”. This is why our investment team believes that more active and tactical investing and trading strategies, versus buy and hold ones, will likely be a better way to invest for a number of years. Stay tuned for more on that topic in the weeks and months ahead.
Oak Harvest Financial Group manages broadly diversified equity portfolios that balance risk and reward for our clients. The investment tools our advisors and financial planners use are usually a combination of markets based and insurance-based tools to meet your retirement goals.
Our in-house investment team is busy working on new tools for our advisors and retirement planning teams to use in the future. Stay tuned. The future and stock markets are always uncertain and that is why our retirement planning teams plan for your retirement needs first, and your greed’s second.
Give us a call to speak to an advisor and let us help you craft a financial plan that helps you meet your retirement goals. Call us here at 877-896-0040 and schedule an advisor consultation. We are here to help you on your financial journey into and through your retirement years.

Chris Perras
CFA®, CLU®, ChFC®
Chief Investment Officer, Financial Advisor
Chris is a seasoned investment professional with over 25 years of experience working with some of the most successful money management firms in the world. Chris has made it a point in his career to adapt as the market landscape changes, seeking to utilize the appropriate investment strategy for a given market environment. His transition from managing billions of dollars at the institutional level to helping individuals and families retire is guided by a desire to see first-hand the impact he is making in the lives of clients at Oak Harvest.
Click to subscribe: