
4Q25 Outlook: “Let’s Get it Started” – V-Bottom Month 7. Stock Market Update, Friday October 17, 2025

Maybe 5 or 10 years from now investors will look back and cry about the 21 trading days in September of 2025 as the top of the AI bubble. My view is I doubt that will be the case that we’ve seen the top. Moreover, I also disagree with the recent calls from the like of the legendary trader Paul Tudor Jones, that we are late 1999 replicating the near end of the Dot.com bubble.
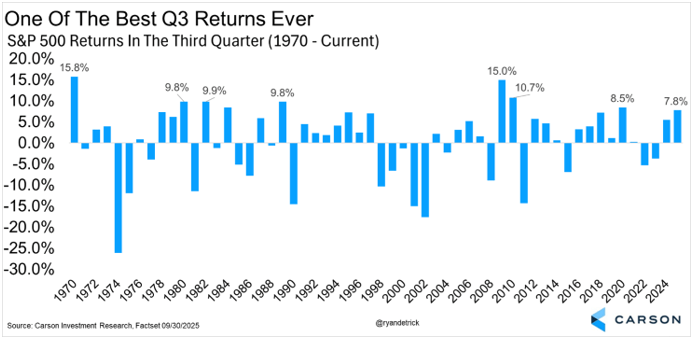
Yes investors, we just got through a near historic 3q for stocks, particularly the combined positive returns of August and September which historically amount to nothing “net” over the 2 months with Augusts up return being most often erased by a down September. Here is a chart from Carson showing 3rd quarter returns since 1970.
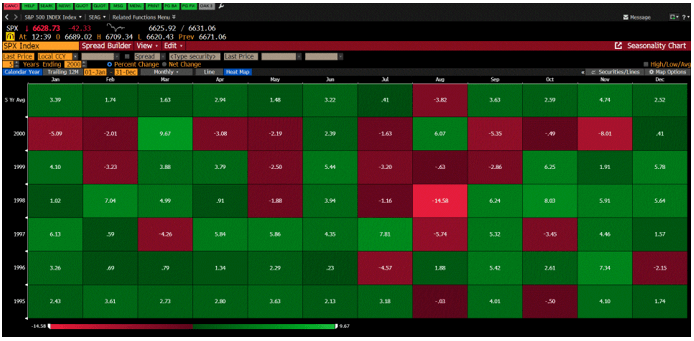
First off, I flat out don’t see the comparison to the 3q quarters during 1998-20 Dot.com run. The data says otherwise. In fact the 3rd quarter was negative each of those years. In fact in PTJ analogy, its early 4q99. I can’t disagree more. In the summer of 1999, the S&P 500 was down -6.69% not up +7.6%+ like we just were in 3q25. Here’s the seasonal table for the S&P500 throughout the Dot.com internet buildout for you to make your own decision.
PTJ was a world best trader in his days, however I would argue that like most of the retired billionaire HF managers I have heard on financial TV for 5-10 years, most all of their advice has been ill timed or just flat out wrong. They don’t trade the way they did when they were making their fortunes. I mean it doesn’t take much of a Google or Gemini search to see that PTJ has been negative for years and as recently as May, PTJ was saying the S&P 500 would fail to rally and take out its April Tarriff tantrum lows regardless of a Tarriff truce. The S&P 500 rallied over 23% in the 5 months since his call. Nearly in a straight line. With very little volatility. And now, near what looks like a ST top in early October, says you need to get long and ride the last innings of a bubble up move? Looks like advice than most should ignore and consult with your advisor to see where your plan stands with the gains most of you likely have in stocks YTD.
If you have been following our videos, we’ve been discussing the Dot.com internet build versus the AI buildout analogy for over a year and increasingly positive on it since the mid-April stock market V-bottom this year. Others have been trying to scare you 1. About the comparison in a negative way and 2. About it being a bubble.
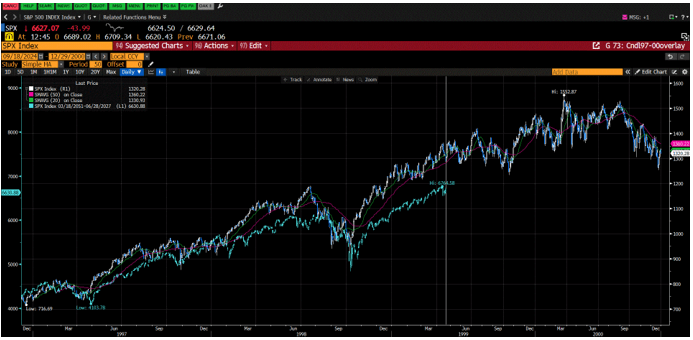
This might be the 10th video I’ve done on this the last 5-6 months. In our work, if you are making this analogy, our April 2025 Tariff lows , when the S&P500 was down -21% off its highs, correspond to the LTCM lows in early October 1998, with the S&P 500 also down -21%. Using this as the timing overlay, which has accurately and almost precisely mirrored the Dotcom rally, would put you in is in late March 1999 say 3-4 more months to go in our initial V-bottom rally to more new ATHs. Would this make sense now? To me the answer is yes. No one still gets in. Here’s the longer term overlay.
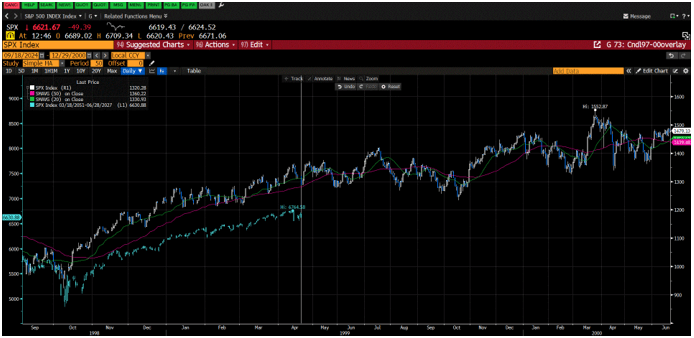
And a zoomed in version of where we would be and where we could go in the future.
We are heading into the seasonally strongest period of the year, the 4th quarter. However, I am expecting most of the net gains of the 4th quarter to come in Decmber.
The Presidential cycle is in investors’ favor in the 4th quarter in the first year of the presidential cycle, leaning very positive averaging a +3.8% gain with a 77.8%-win rate.
That kind of return would say we print 7000 on the S&P500 sometinme in December.
As I’ve discussed since mid-April, V-bottom moves and seasonal history says the rally in stocks isn’t over. We’ve covered the data the last few months on this. Go check out our prior videos on the topic
Today, the AI buildout is leading. These high relative strength groups may pause for a after their stellar Septembers and 3q performance, but they will likely continue to work in the months ahead. Throw in some down and out healthcare and energy and material names who have been beating numbers but whose values have been cut in half by government and economic growth fears.
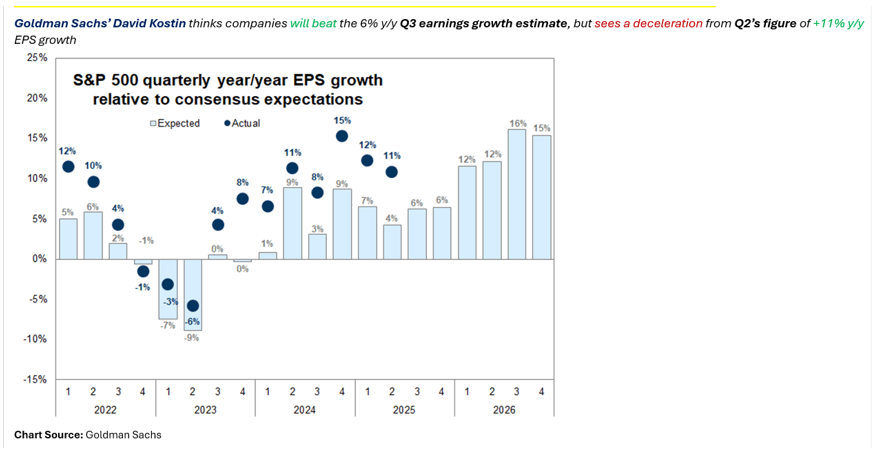
What could cause a true parabolic move in stocks farther out in 2026? Well, just guessing but, a new more dovish Fed chair appointment by President Trump next April/May would correspond almost exactly to when the last up leg of the Dot.com run began. Recall the Dotcom run lasted almost exactly 18 months from the LTCM bottom in October 1998. But Chris stocks move on both interest rates and earnings and 2026 earnings can’t support that kind of up move is a comment I’ve heard. Well not if you believe the quarterly earnings estimates that Goldman Sachs has. Here’s their table for quarterly S&P500 earnings growth rates historically and in 2026.
Investors recall that the overall S&P 500 index historically anticipates economic and earnings bottoms by troughing 1-2 quarters in advance of the economy. However, that isn’t the case at market tops. Historically, the S&P50 tops coincident with earnings growth rates. It hasn’t historically peaked in advance of the economy and earnings growth.
Investors why not be prepared in advance of the 4q25, to hear about the “chase for performance into year-end” before it takes place. Investors, if the V-bottom pattern continues its historical path, which I expect, maybe we hit new ATH into October month end and pull back again in November before the yearend rally and sprint begins. V-bottoms, historically, do not have ended or deep pullbacks on % terms until after the 10th and 11th month as you approach a year holding period for those investors who bought at or near the lows. Think back to the Friday selloff a week ago. The market dropped about -2.5% and quickly regained its footing early the next week. Expect more of that over the next few months with pullbacks largely being buying opportunities into mid 1q26.
Know that regardless of the path for the economy and financial markets in the next few months, the investment team at OHFG will be here.
Until next week, have a blessed weekend and know that the OHFG team is doing what we can to plan for you and your family’s future regardless of what stage you are at in your career or retirement.
Do you need a retirement plan that goes beyond allocating funds to truly fit your needs? We can help you create a retirement life plan customized for your retirement vision and legacy. Call us at 877-896-0040 or fill out this form for a free consultation: https://click2retire.com/lets-connect

Chris Perras
CFA®, CLU®, ChFC®
Chief Investment Officer, Financial Advisor
Chris is a seasoned investment professional with over 25 years of experience working with some of the most successful money management firms in the world. Chris has made it a point in his career to adapt as the market landscape changes, seeking to utilize the appropriate investment strategy for a given market environment. His transition from managing billions of dollars at the institutional level to helping individuals and families retire is guided by a desire to see first-hand the impact he is making in the lives of clients at Oak Harvest.
Click to subscribe: