
Feeling Uneasy about the Stock Markets? Watch This
Investors, in the next 10-15 minutes we are going to dive into a few things our team looks at in the markets that historically have led to market moves. Several of them are just fun historical facts that keep repeating, and others are the usual real time data series that our team keeps discussing time and time again. The good news is that virtually all of these “indicators” are aligning to say the typical 1st year presidential term, 1st quarter sell off should be behind us and greener stock prices are ahead. However, I remind investors that we have anticipated that the first 2-3 quarters, not weeks or months in 2025, should see higher volatility than both 2023 and 2024 and of course that’s EXACTLY what has happened last month.
Let’s start with the fun facts, the ones only insiders know. Well, the first one is in my investment career, almost all major stocks selloffs have happened. When I’m on a multi-day pre-planned vacation. This year, 2025, of course has proven that factoid a “money trade” once again. Left for NYC Wednesday Feb 19th, which was the closing high for the sp500 at 6144 and the market promptly dumped. Left for Florida, Friday March 7th and returned to the office Thursday March 13th which so far is the closing low for 2025 at 5521. Folks, this isn’t just a one-year thing, It’s happened time and time again for 25 years. Maybe it’s because I tend to take vacation in the seasonally weakest time of the year for stocks, Mid-Feb through mid-March or maybe its just just bad luck, but its happened time and time again for years. And clients and financial advisors ask me why I never take vacation? Well, no you know one of the reasons, and no money never sleeps even while you’re on vacation. The good news for investors, I have no significant planned vacation again until? Feb 2026! Almost an entire year from now.
I know many of you might laugh at this, but if you are a trader, you trade things like this until they stop being coincided. I have a great friend and mentor, who is over 80 and still very active in the industry running his investment business. He loves to short-term trade stocks because it keeps him mentally nimble and its become fun and profitable for him even though he is financially secure. So what’s the worst thing that can happen to a trader when you’re out of the office? Yeap, big prices move particularly upside ones. As luck would have it, my friend also like to play golf and take his family on really nice vacations for a week or two. Guess what almost always happens when he leaves the office and is not near his machines to trade? Yeap, almost always straight lines higher in prices with little to no pullbacks leaving him “missing out” on the trading moves.
There are a handful of other things I’ve seen time and time again that tend to be tells at market inflection points, both up and down. At tops, my friends call daily asking for stock tips and if I recommend something that’s “boring” they generally pooh pooh it and say they want something to make 50-100% this year. At market lows, the same friends call asking what percentage odds I am places for a economic recession, or to tell me they just moved their IRA into cash because things don’t look good. Investors, one of the biggest fallacies put out there the last 10 years, along with the predictability and value of Fed funds futures, is sell side strategists lobbing “recessionary odds” like they are bookies. Folks, here’s the odds, ZERO or 100%. Not 60/40, not the absurd calls for models being at 37% or 52%, folks its zero or 100% in my book.
Which brings me to some real time data series that we’ve discussed many times over the last 7 years all of which are saying nearly the same thing, good things are ahead, bad things are behind us. Doesn’t mean no volatility, but they do say that this is a ordinary 1q decline in stocks and the dip or whatever you want to describe the last month is should be bought for now.
Quickly in order of importance from lowest to highest to me:
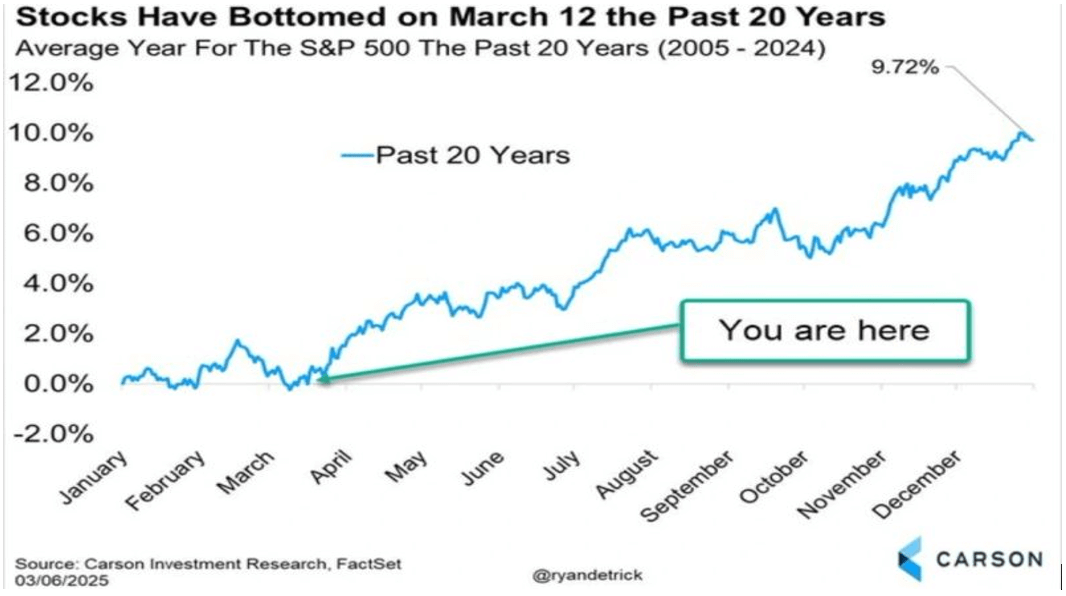
- Better seasonals kick in after mid-March as mid-March is historically the seasonal low for the year in most first year Presidential terms and also over the last 20 years. A great chart from Carson analytics. Historically, March 12th has been the low.
- Real-time currency pairs like the Euro/yen, that have been in an upward channel since the Covid lows, and have historically signaled one to take more risk, not less risk, are rallying. This cross peaked in July of 2024 and sold off, and the SP500 quickly sold off -9.7% back then. This currency cross peaked again in mid-December and sold off through the end of February and the SP500 dropped -10.1% peak to trough. It’s back in rally mode as Europe is stimulating growth and Japan is raising interest rates. This currency trend is a positive leading indicator for equities.
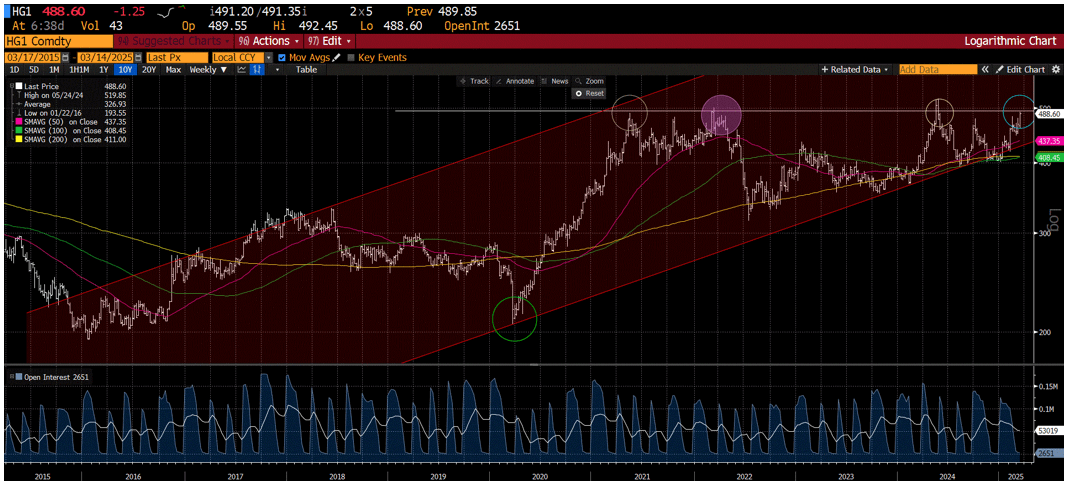
- Doctor Copper is perking up and close to breaking out of a MASSIVE 4-year base at $488/contract. OK, admittingly, for years I have said I hate this saying about Dr. Copper having a PHd in economics. It’s largely nonsense for the US economy and other developed ones. Why? Because emerging market economies and their demand has driven the incremental demand for copper for decades now, not US construction or US demand which had been the case prior to 2000 and the build out boom in China and India in the last 25 years.
That said, I find it almost comical that virtually every sell-side strategist, who was wrong about 2023 and 2024 being too bearish, and who started 2025 too bullish on equities and the economy, seemingly trying to catch up, is now cutting their forecast, just as Dr. Copper is saying they should likely be raising them for the 2nd half of 2025. FWIW, for the first time this year, the purely mathematically driven volatility model I run, that has proven pretty darn precise and accurate since Covid, says that 7000 on the SP500 in 1q26 is now a more likely, not less likely outcome.
4.The US dollar, or DXY index has topped and is trending lower not higher as many in the financial press was parroting just in December. Same with market priced interest rates. Both of these trends are better not worse for earnings in the 2h25 and valuations in the 2h25.
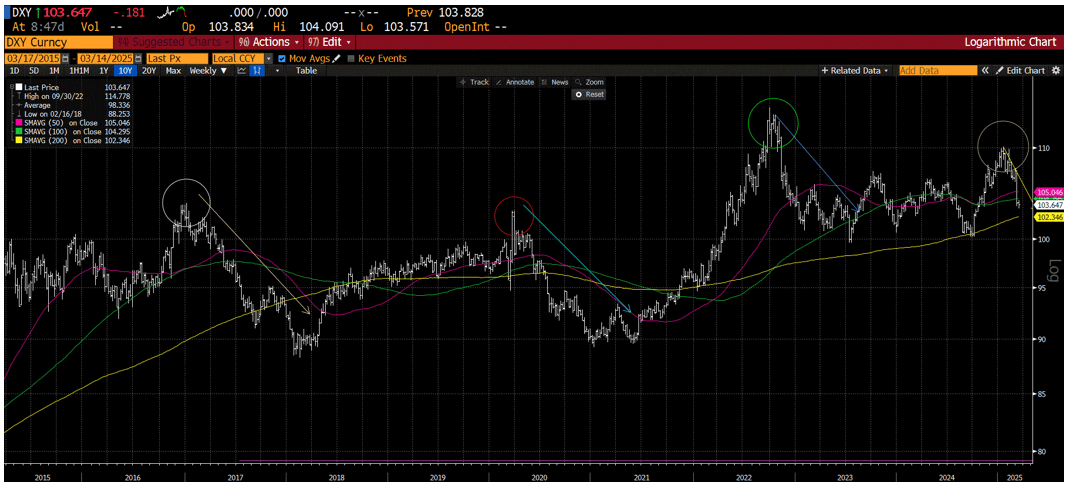
Recall that is was only 3 months ago in late December, with strategist optimism for 2025 running high and the S&P 500 near 6100 that most strategists were declaring that interest rates were going to 5-6% and the dollar was going higher because of Trump policies, both calls coming almost at the EXACT tops in both. Now with both lower interest rates and a lower dollar, somehow these same strategists have forgotten that these are now tailwinds for earnings in the 2h25.
5.Finally, I leave the best for last. Investors, short term, real time real interest rates, I’m looking at the fast-twitch 1yr real rates, which I have found is a great proxy for shorter term real growth expectations look to have troughed near exactly when as every year for the last decade. Mid-March to the end of March.
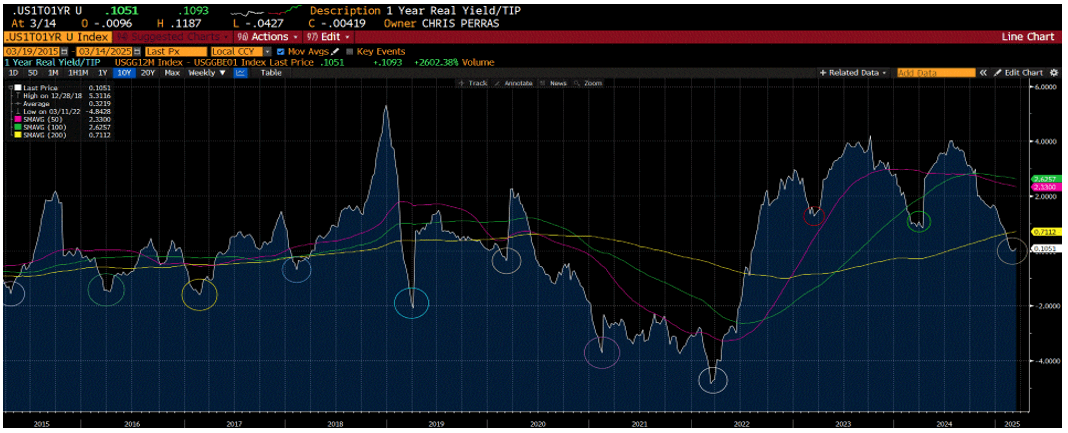
Investors, if you’re panicking now, all of these indicators, which have led rallies in stocks for this cycle, they are all saying the same thing, don’t panic here, there should be a better place and time higher to sell in the coming 3-5 months if your investment allocation is mismatched with your risk tolerance.
Are there other indicators saying it would be better to buy than to sell here? Yes, there are quite a lot. AAII sentiment data is as bad as it was at the lows in March of 2009 at the spot on lows of the GFC. Volailty indicators are saying that much of the forced liquidation at hedge funds and in leveraged ETFs is over for now. US. Money supply growth is now accelerating to almost 4% YTY which is the fastest in 2.5 years.
Investors, no guarantees in the stock market, and the first two months of 2025 are proving that a lesson to those who just entered the markets the last 2 years and enjoyed +20% returns. It’s been a sloppy, choppy mess which while uncomfortable to those watching day to day or week to week, as we previously warned, 1- is not unusual as the average year has a drawdown of -13-15% at least once and 2- higher volatility was likely to be the case for the 1st half of 2025. Did we see a -10% drop in less than 20 trading days, the 5th fastest correction in history coming? No. But here’s the data from Seth Golden showing, historically, swift and fast down, has been followed by very profitable investment returns over the next 3,6, and 12 months.
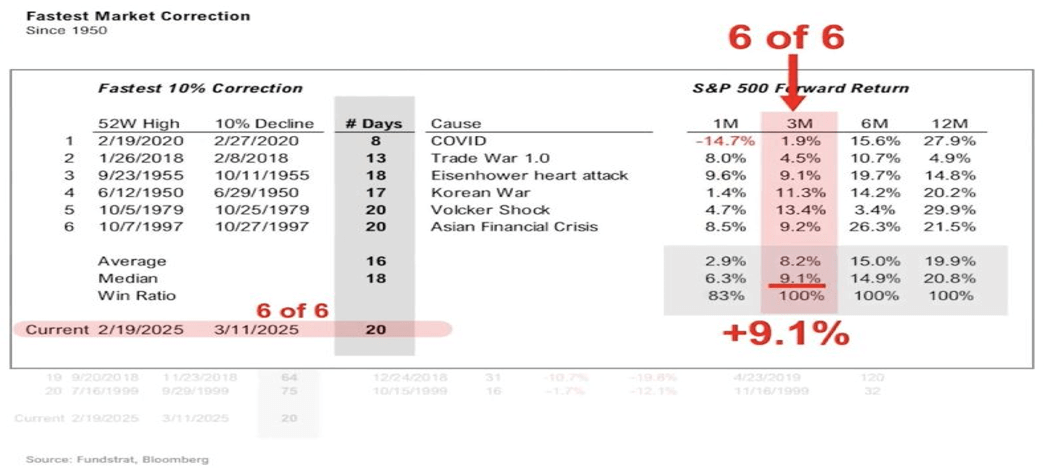
100% is a pretty high batting average in my book, of course no guarantees that history repeats again but great data. I remind investors, that even in the soft landing, Alan Greenspan led 1994-1999 stock run, in 1996, 3 years in, the S&P500 dropped -11% peak to trough in the 2q26, broke the 200 day mva for 2 weeks and caused lots of heartburn for investors, but ultimately went on to make new ATH in the 4q96 and the next few years.
A repeat of the gloriously boring and straight line up of 2017 under the first Trump presidency was a very unlikely scenario in our work. The main reason we did not see a direct repeat coming in 2025 was the fact that in 2017 DJT focused on one and only one thing, lower taxes and getting that policy through congress. Lower taxes equal lower friction on consumers and corporations and shareholders love that! The GOPS linear focus on taxes caused the SP500 to move upward in 2017 in a near linear and historically low volatility year.
DJT 2.0 out of the gate, it appears that Trump is going for the early shock and awe taking on a myriad of policy changes in rapid fire manner. Immigration, tariffs, foreigner policy changes, and government firings and downsizing by the DOGE, while potential good for taxpayers and citizens over time, short term do what? They all increase friction in the economy. The all increase costs to the economy short term and shareholders and financial markets hate added friction. Is this max friction? The data behind the scenes says that’s highly likely, just as others panic and tought their recessionary odds.
While all of the current policies in DC are anti economic growth in the short-term, real-time inflation expectations looked to have peaked while real growth expectations have troughed just as others say the reverse.
With most of our real time data series flashing troughs and bottoms, I am actually more optimistic thinking about the next 12 months even as the markets are lower than 2 weeks ago. What if Trump is crazy like a fox? As a voter you don’t have to like him or his policies, but that isn’t what investing is about.
What if this time around, he and his staff have decided, let’s tackle all the hard stuff first. The economy is pretty good, albeit overstated, but let’s get all those friction items out of the way the first 6-9 months. Let’s get that done first, and then we will focus on the easy stuff, the stuff everyone who is a shareholder or consumer likes, lower taxes, less regulation. Things that lower friction in the economy? Things that would accelerate the economy in late 2025 and throughout 2026 so GOP members can get elected or re-elected in the midterms in the 2h2026. What if, from an investor’s standpoint, he’s crazy like a fox? Think about that.
Soft landings in the economy do NOT guarantee no volatility. This time around, the Trump administration seem to be going for the early, “shock and awe”, taking on the tough policy issues first.
The good news? We are oversold and historically speaking, nearing what is normally a low in both economic growth expectations in the 1q, a seasonal low in the stock markets, and yes, a seasonal high in inflation concerns.
Investors know that regardless of the path for the economy and financial markets in the next few months, the investment team at OHFG will be here crewing the ship and adjusting our models where we can. We expect 2025 to be a very active year for active stock management.
Until next week, have a blessed weekend and remember you have some legal inside information now, my next real vacation isn’t for 11-12 months, maybe more, and historically speaking, that’s been a good thing for stocks.

Chris Perras
CFA®, CLU®, ChFC®
Chief Investment Officer, Financial Advisor
Chris is a seasoned investment professional with over 25 years of experience working with some of the most successful money management firms in the world. Chris has made it a point in his career to adapt as the market landscape changes, seeking to utilize the appropriate investment strategy for a given market environment. His transition from managing billions of dollars at the institutional level to helping individuals and families retire is guided by a desire to see first-hand the impact he is making in the lives of clients at Oak Harvest.
Click to subscribe: