
Trump 2.0-History Repeats?

The voters voted, the votes are counted, there was no debate, arguments, or riots, and Donald Trump was re-elected as President. At the end of the day, as James Carville said in 1992, “It’s the economy stupid” and the voters voted that way. They voted down Bidenomics and the Harris immigration stance the last 4 years and were less swayed than most thought on social issues.
Troy, Charles and I will be doing a livestream on Thursday Nov 21st at 6pm focused largely on the potential outcomes in the financial markets and the economy of a second Trump presidency. Theres a link in the description below in case you want to tune in live and ask questions. It should be our normal fun time, and I think there will be lots of thoughtful discussion and great information in it for investors, clients and OHFG prospects.
I also suggest you go back and watch my last 3 videos particularly the two titled “Will 2024 echo 2016? What a Trump win could mean for the Stock Market and economy? I posted the Friday before the election, and a second titled, “Stock market hedging before the Election-Are you overpaying?”, which was done in late October as the media was touting end of the world scenarios for election day itself. I think both proved rather prescient and show what our team looks at behind the scenes to gauge investor sentiment and positioning, trying to strip out emotions.
Given the length of next week’s event, and our lunch and learn last Wednesday, I’m going to make this a quick video and mainly filled with many charts, historic data, and comparisons to late 2016 when Trump unexpectedly won. I’m not going into much detail here as hopefully we will cover the verbal side of these charts next Thursday night..
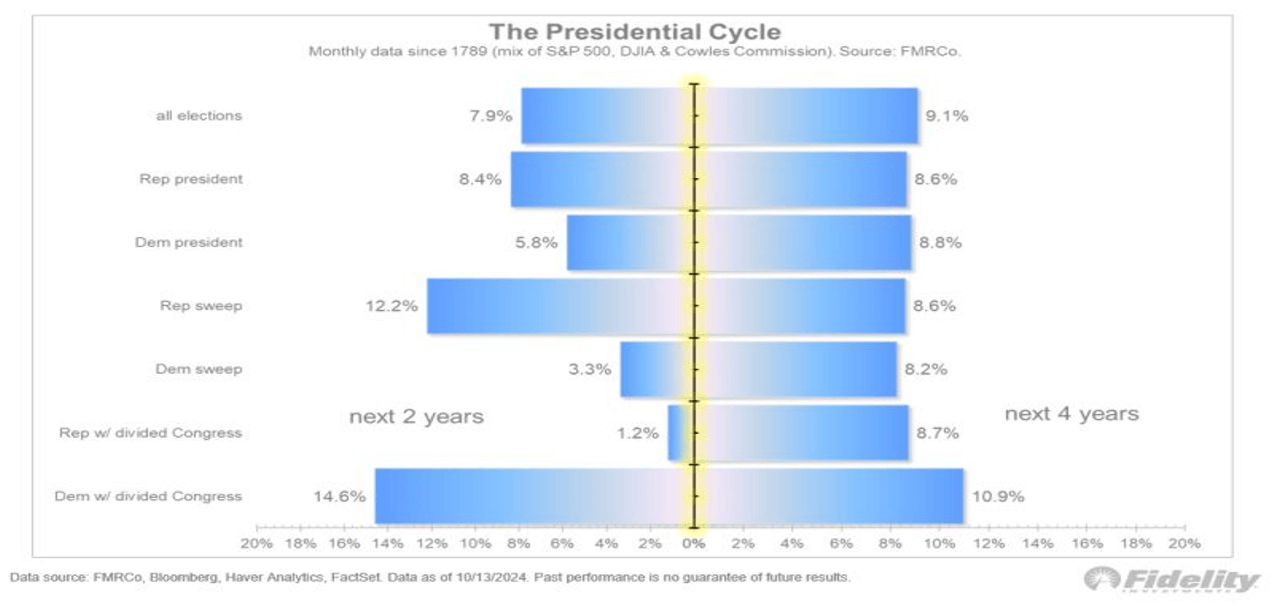
First, the political makeup in DC is historically good for your money. A GOP sweep in DC is historically the second-best setup for stocks, only slightly behind a Dem President and a GOP Senate.
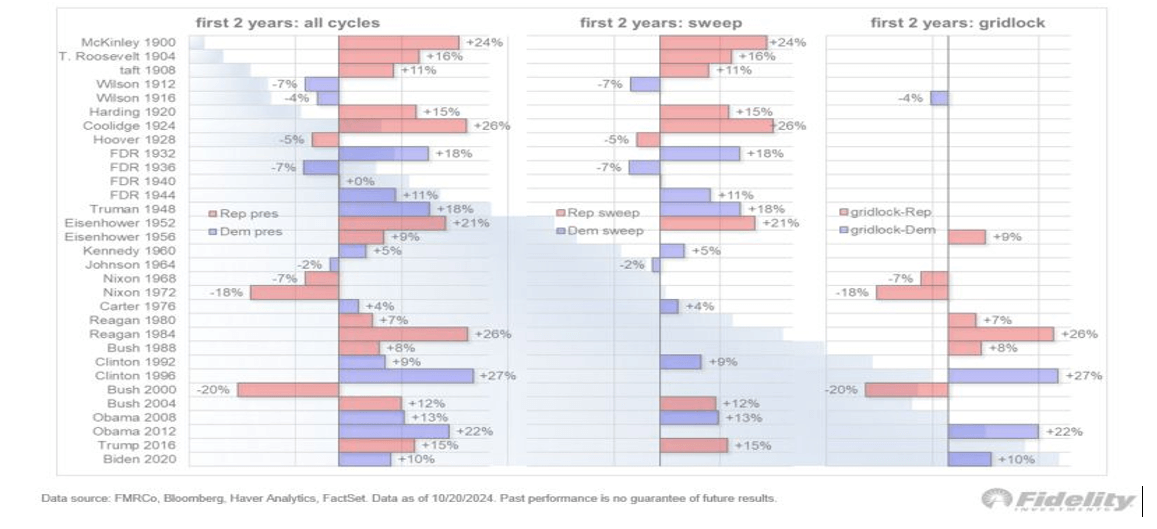
The first 2 years averaged over 12% under a GOP sweep according to Fidelity.
Here a table we presented last week with stock returns under party “sweeping” the Presidency, House, and Senate over the next 2 years
Contrary to most thinking, historically, sweeps have not been disasters for the markets. GOP sweeps have been slightly more favorable than DNC ones. Here’s the 4-year annual return data compiled by Fidelity.
Here’s a great graphic from my former employer Invesco comparing stock returns to economic growth during each President since 1957.
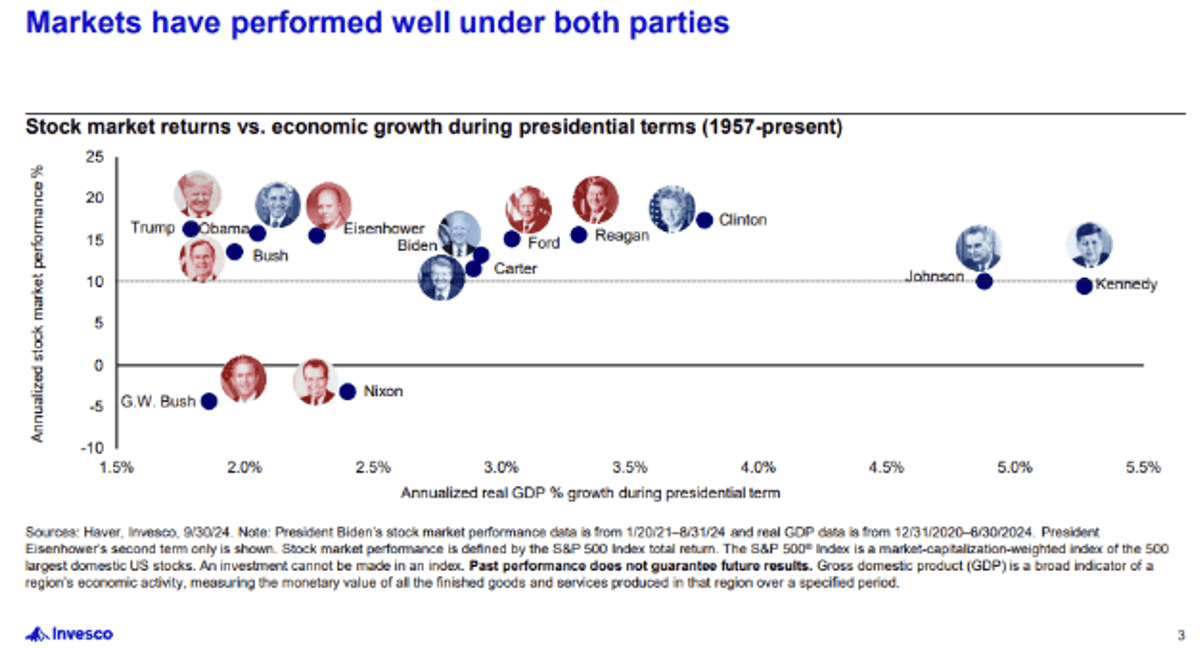
Your money is green, not red or blue.
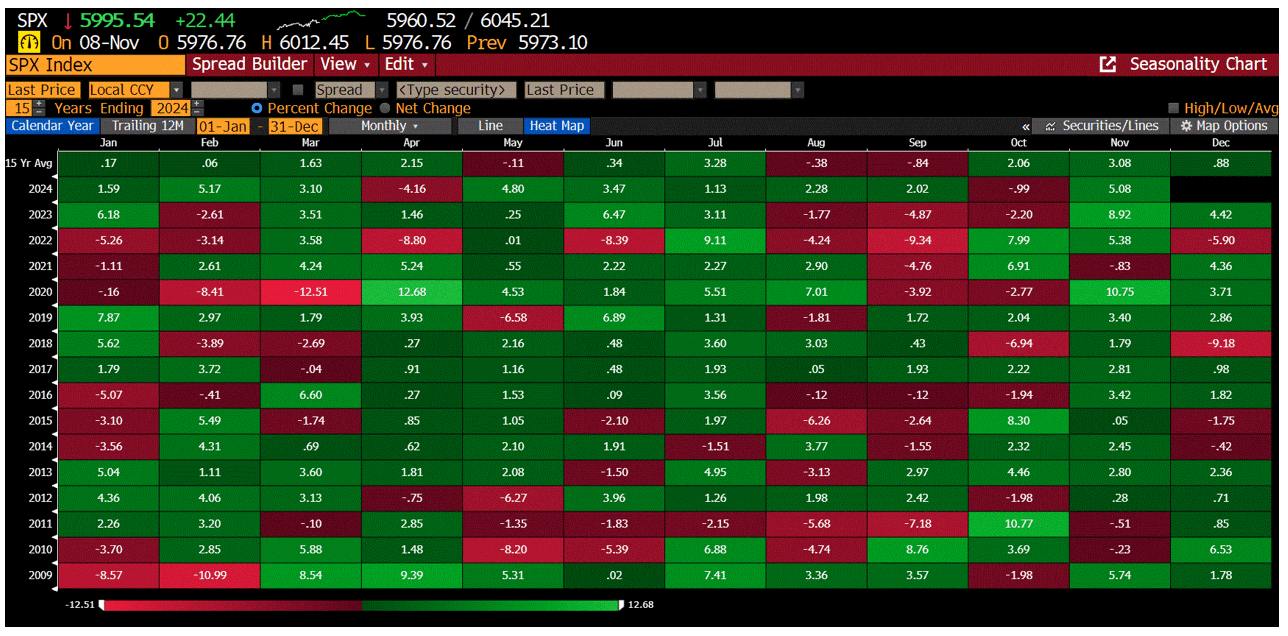
We are now in the seasonally strongest period of the year, November through April. Here’s the monthly return data of the S&P 500 for the last 15 years.
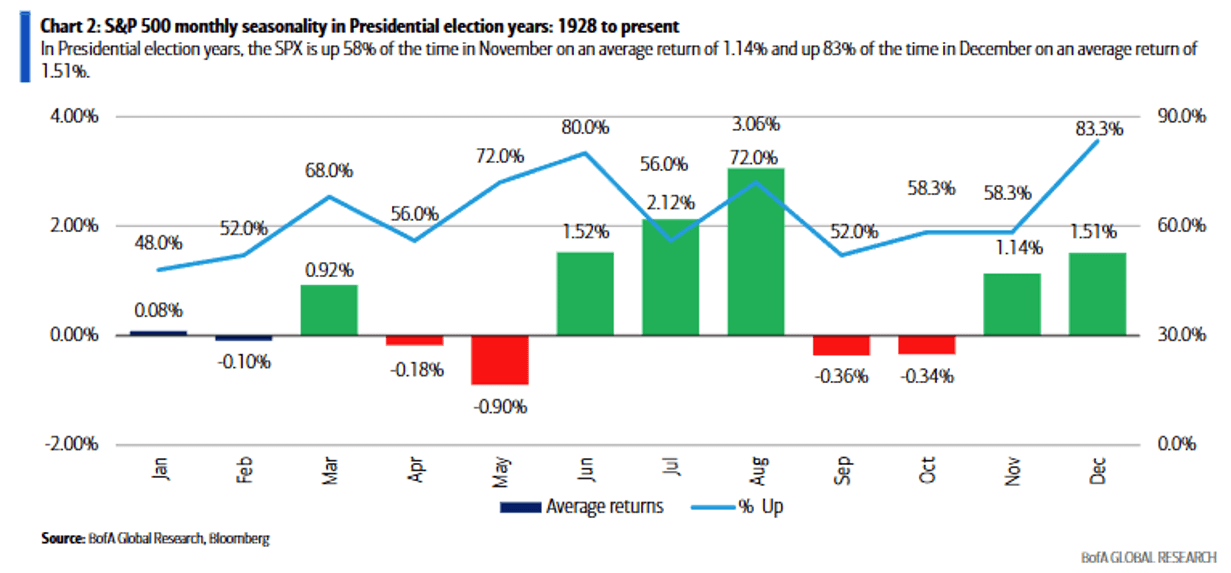
And here’s the seasonal data for Presidential election years dating back to 1928 from Steve Suttmeier at BOA. Remember viewers, we first discussed this almost a year ago into year end 2023 as a bullish setup for 2024 stock returns.
Also, strong 1st half stock returns usually lead to strong finishes. Here’s the data on historically strong 1h’s and how they have ended.
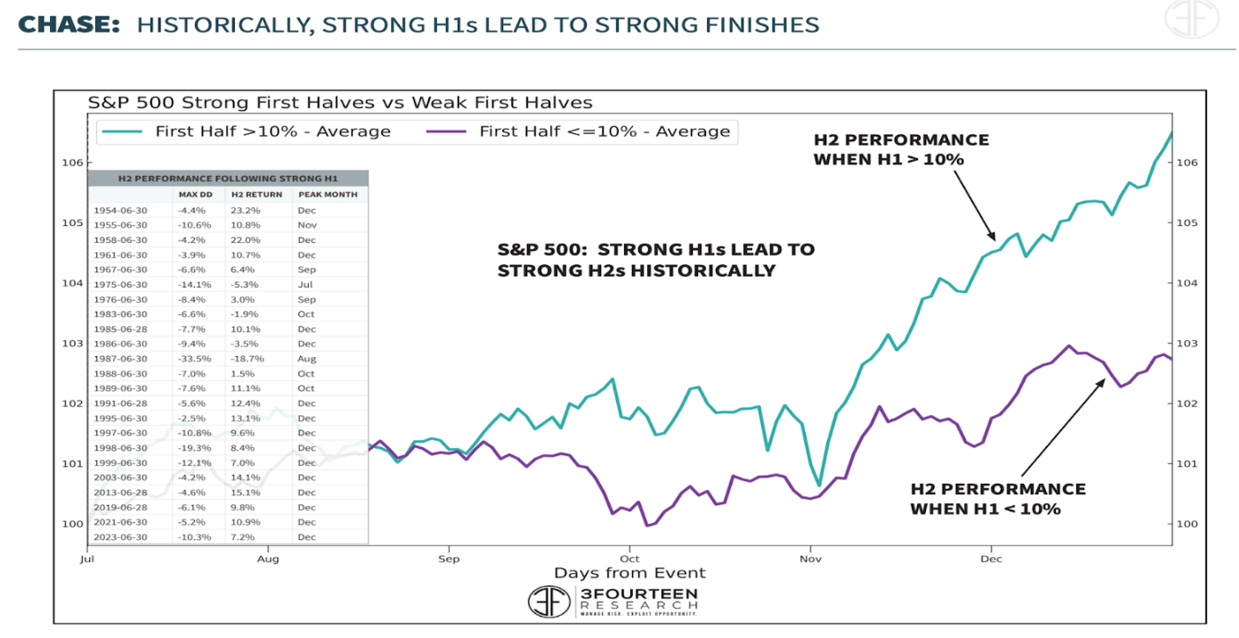
Strong 1st half stock returns usually lead to strong finishes.
Here’s more data on historic stock returns in good first 3 quarters from Charlie Bilello. He always has great stats. This is data back to the Great Depression showing the best returns and what happened through year end.
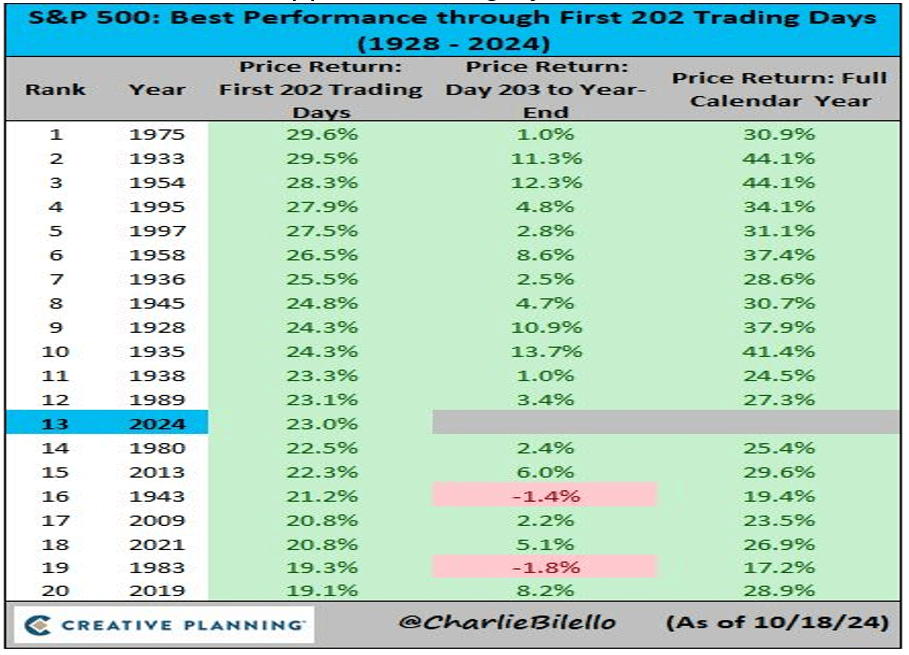
It’s very rare to have a down return in the 4th quarter after a strong first 9 months. In fact, only 2 out of 19 years have we had returns of over 19% for the first 3 quarters and had a down 4th quarter, 1943 and 1983. History says, your money, if invested in the US stock market index S&P500 should be treated very well through at least the inaugural ball in 2025.
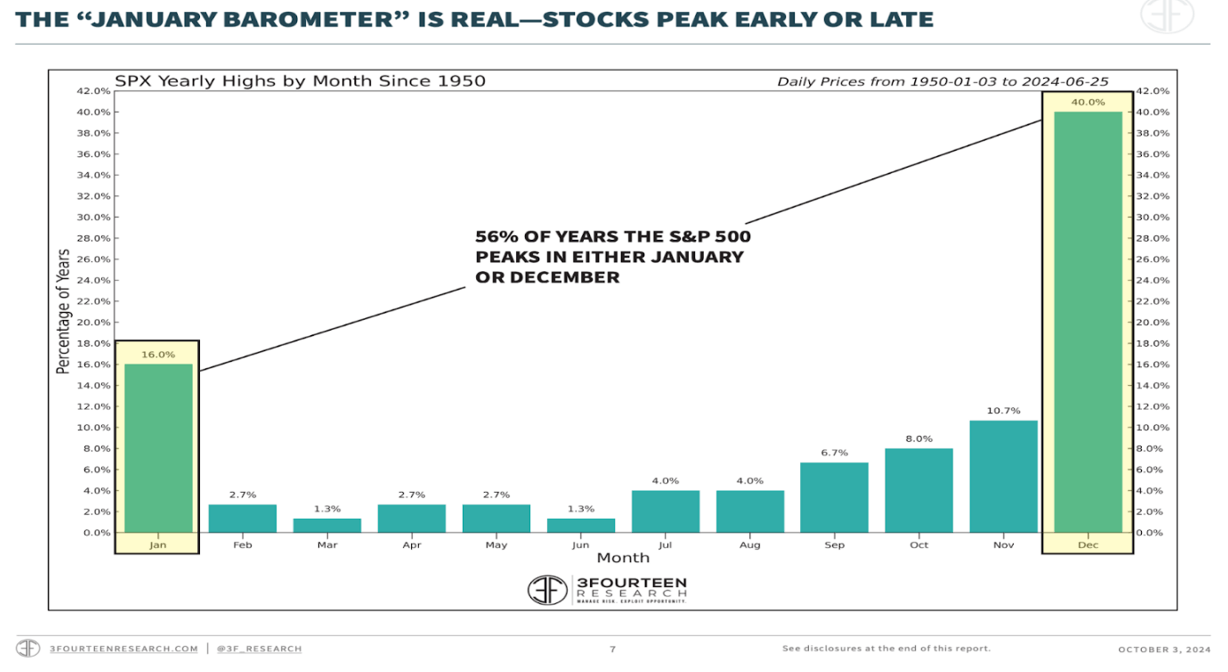
Another great chart from 3Fourteen Research on seasonality. Historically markets top in December or January, not in November.
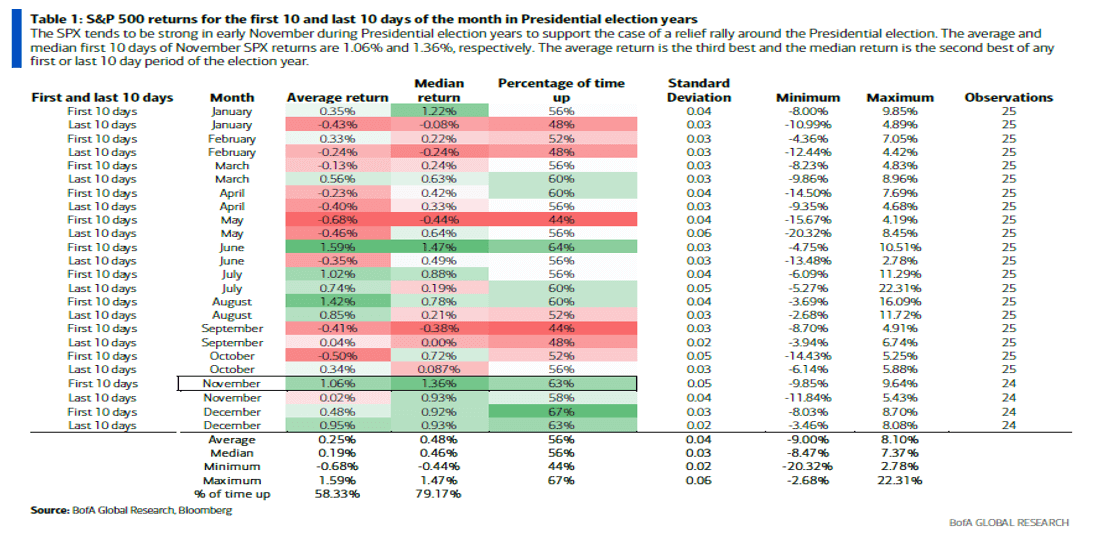
For shorter term traders here’s more trading data from Suttmeier at BOA on the first and last 10 trading days of each month during Presidential election years.
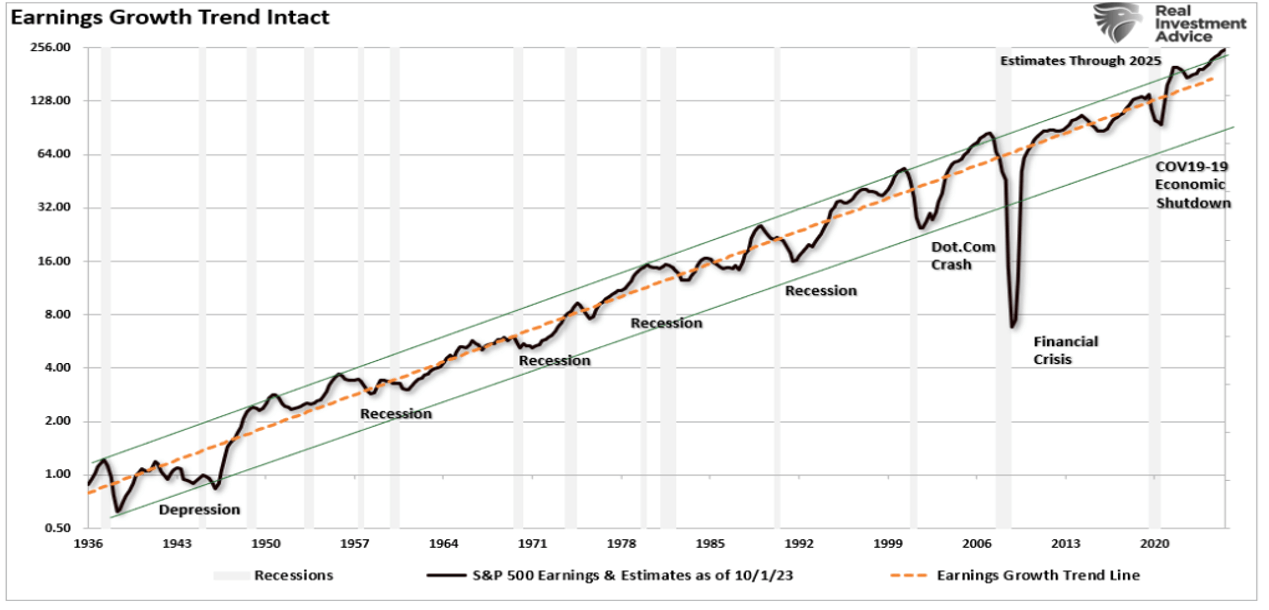
I know at least 48% of voters aren’t pleased with the outcome, however as I have messaged for 6 years at OHFG, your money is green, not blue or red. Stocks move on earnings, more specifically changes in free cash flow, and interest rates. Here’s a chart from Lance Roberts on S&P 500 earnings and earnings growth rates. Over long periods, up and to the right regardless of President.
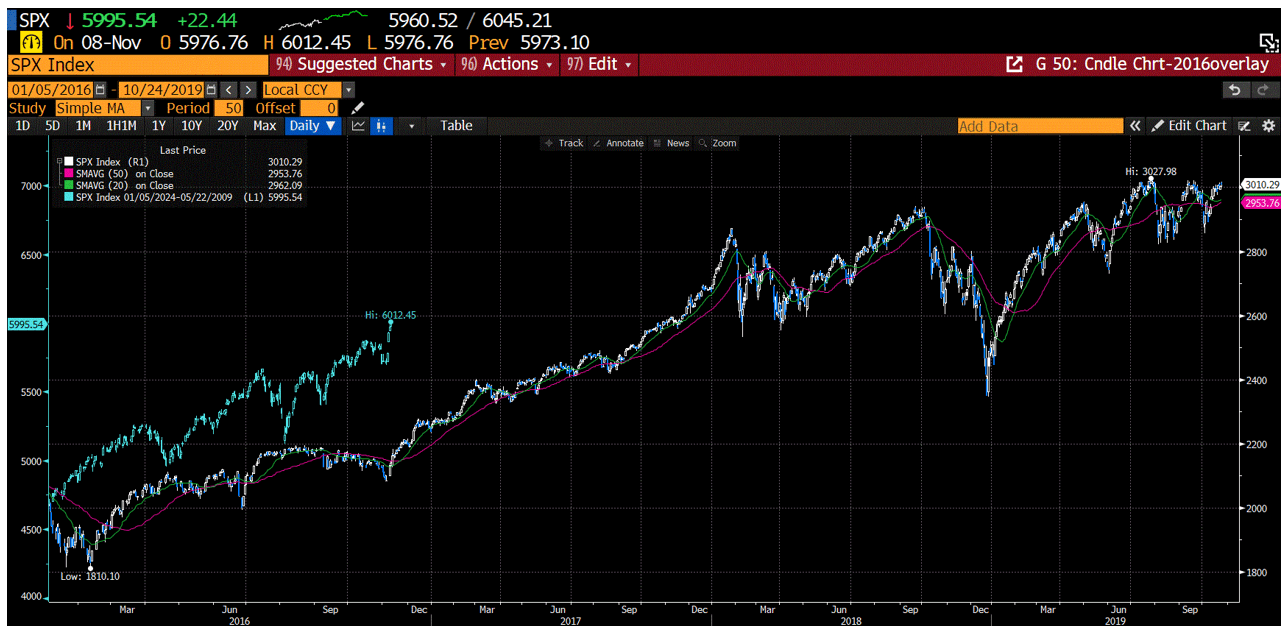
Trump 1.0 brought in lower corporate taxes, moderate inflation, relatively stable interest rates, and higher S&P 500 earnings in the 2h17 and 2018. And stocks and your money loved it. I recall after about 12 months of stock gains, many who were publicly anti-Trump, suddenly were very quiet and smiling. Why? Because the economy was ok, their net worth was up, and things were calmer in the world for the first few years. So, what worked the first 2 years of Trump 1.0? Let’s look broadly at first.
I will overlay 2016-2017 with 2024 YTD-2025 on a chart for a few of the major indexes, First the S&P 500
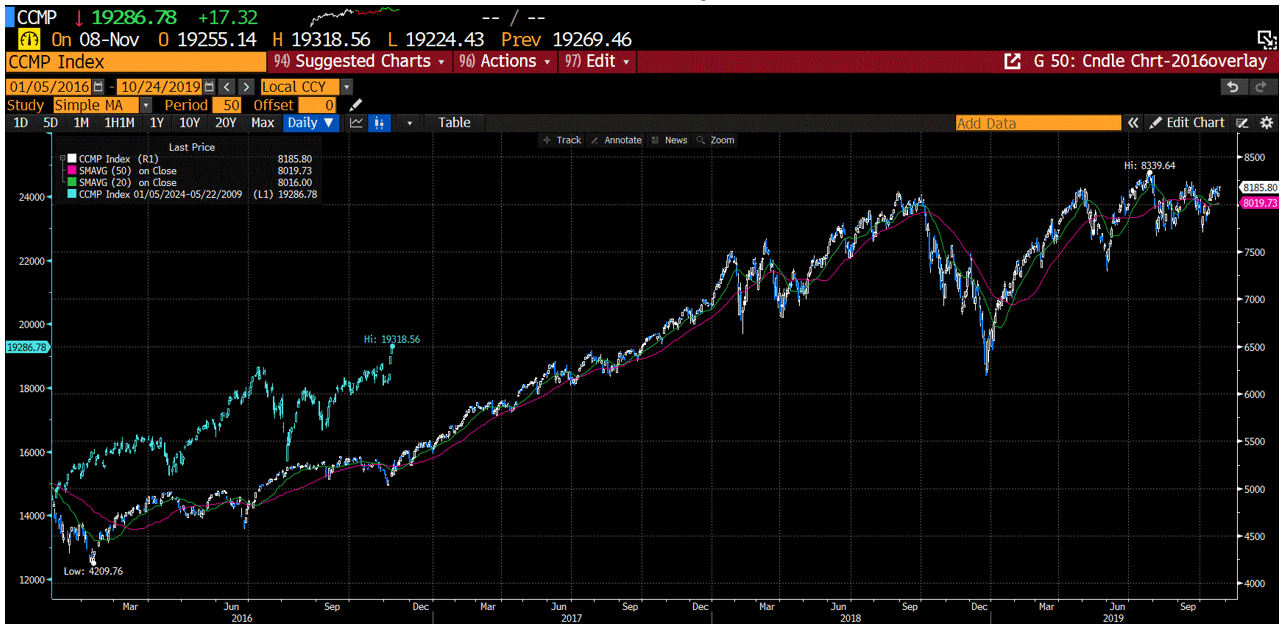
Then the Nasdaq Composite CCMP index:
And finally, what has been a laggard up until recently under the current administration, the Russell 2000 small cap index which is largely domestic names, more indebted, and lots of smaller financial names.
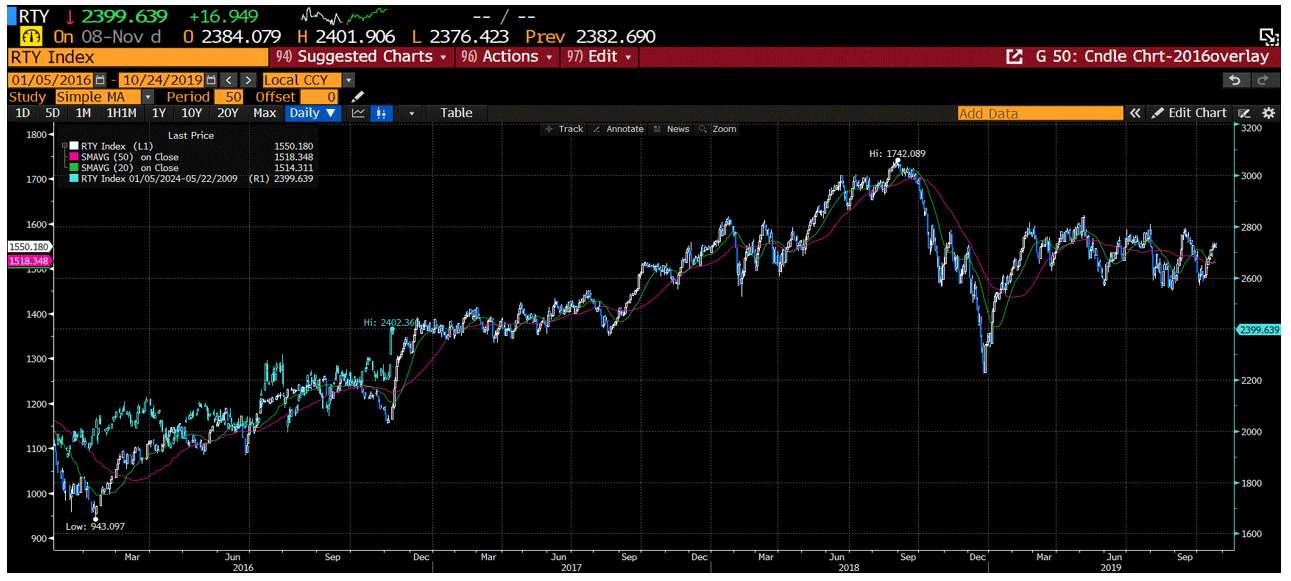
So far, it looks to me like history is repeating in the stock market.
A few other charts to think about? Didn’t Trump bash China right out of the gate in 2016/17? Yes, he did. And let’s look at what the most speculative Chinese stocks as measured by the KWEB China internet index did back then? Here’s the KWEB ETF chart.
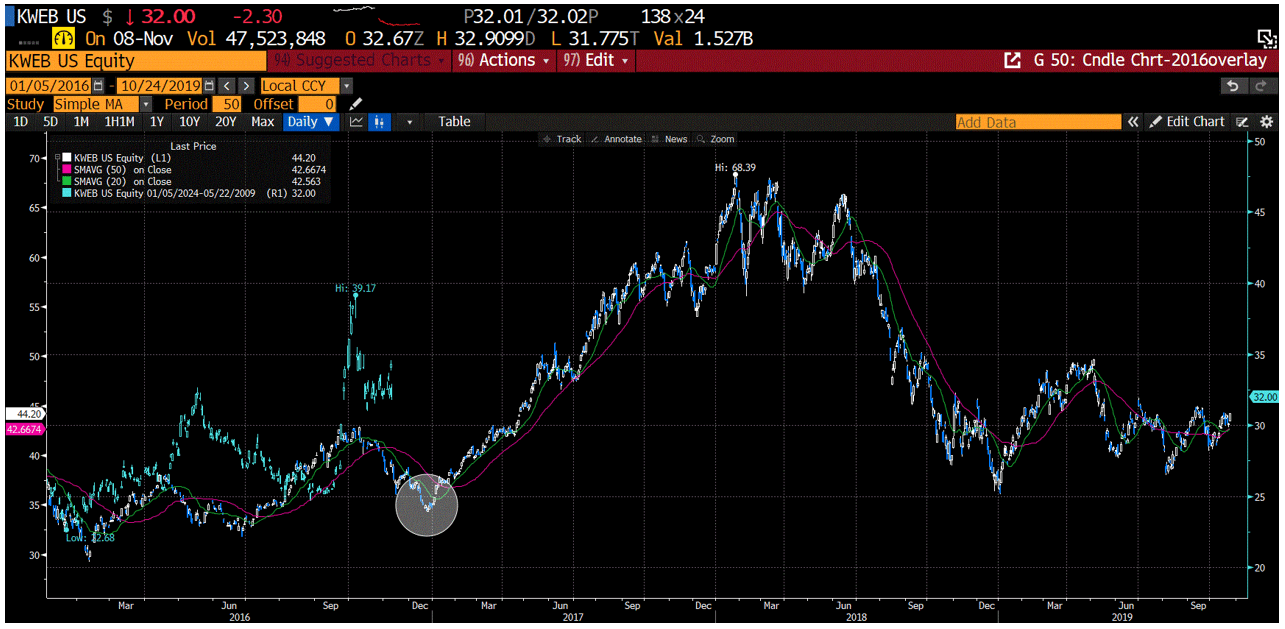
An initial sell off in late 2016 into year end then? Up and to the right all of 2017. Hmmm.
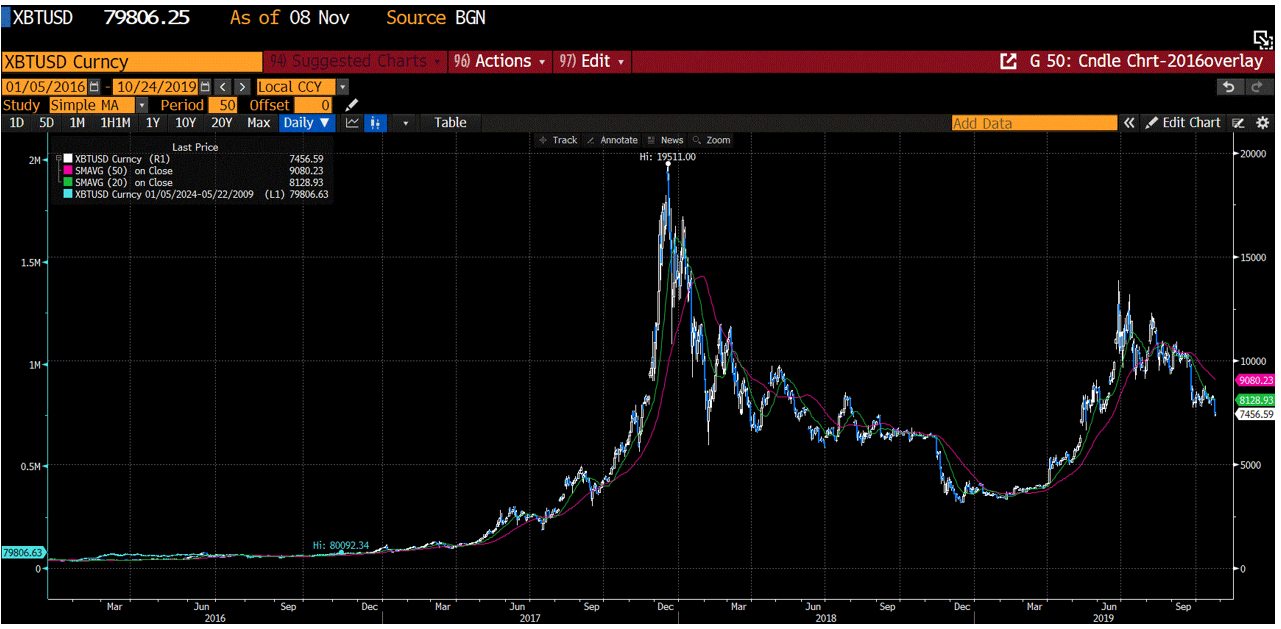
And a chart of Bitcoin, overlaid then and now.
Investors, will Trump 2.0 be different than Trump 1.0 as the doomers say? Will Democracy end any more quickly under DJT than it was ending under prior Presidential terms with orders to waive student debt or allow mass border immigration? I don’t know.
Investors, the biggest surprise I can come up with for markets in 2025. I mentioned it almost a month ago. What’s that? A collapse in implied spot volatility, the VIX index, in 2025 back below 10. Something I personally said for 5+ years would NEVER happen again in my life. But you know what, NEVER is a very long time and history has certainly been repeating the last few years in the markets. I know almost no one can fathom 2025 being less volatile under a Trump presidency than more volatile given what we remember about his first term or the four years of him out of office.
Will volatility go under 10 again in 2025 like it did in 2017, which would equate to an S&P 500 of 7000+ into late 2025? I don’t know, but I can tell you it’s been a secular bull market since around 2011 and a cyclical bull market since the cyclical October 2022 pivot higher after the 1h2022 bear market. That did include a strong bull run up during the first 15 months of Trump 1.0. Investors, it’s still a bull market, until it proves itself it isn’t, regardless of whether your candidate won last week or not. Hopefully, our team at OHFG kept you from making emotional decisions based on politics the last 5+ years. Hopefully, you are enjoying this bull market in stocks whether you are invested aggressively for growth or more conservatively for income.
Investors against the nearing decade long doomer calls from Jeremy Grantham, Harry Dent, Robert Prechter Jim Grant, and a myriad of retired billionaire hedge fund managers that come on CNBC almost monthly to scare viewers. it’s still a bull market, and investors as Martha Stewart says, at least for investors “That’s a Good thing”. https://www.youtube.com/watch?v=fJdrgkR0GcU.

Chris Perras
CFA®, CLU®, ChFC®
Chief Investment Officer, Financial Advisor
Chris is a seasoned investment professional with over 25 years of experience working with some of the most successful money management firms in the world. Chris has made it a point in his career to adapt as the market landscape changes, seeking to utilize the appropriate investment strategy for a given market environment. His transition from managing billions of dollars at the institutional level to helping individuals and families retire is guided by a desire to see first-hand the impact he is making in the lives of clients at Oak Harvest.
Click to subscribe: