
2024 Summer Stock Markets: Where Things Get “Real”ly “Interest”ing

We are almost halfway through 2024, and I will admit, this has been one of the more interesting years I’ve seen during my career. While volatility at the S&P500 Index level remains near historically low bounds, ex 2007, single stock volatility is uch higher than I can recall. You have large cap tech stocks like Adobe trading up 15% on a day or up and down +/-15% in the case of Dell within a 2-to-3-month period.
The S&P 500 continues to follow the Presidential election cycle almost to a T, but below the index level lies a chasm in the dispersion between the two sectors outperforming the S&P 500 year to date, technology and communication services and the other 9 sectors lagging the S&P 500 year to date.
J.C Parets of All-star charts puts this in perspective. As of last Friday, June 14th, The S&P 500 and the Nasdaq 100 both hit new all-time highs. However, fresh 6-week lows the Advance-Decline line of the broader NYSE index hit new 6-week lows. Oddly enough the Advance-Decline line of the Nasdaq 100 also hit new 6-week lows. That’s what market technicians call “bad or deteriorating breadth”. And viewers, while bad breadth it is not a great timing tool, it is a condition that warrants monitoring as it means below the surface, there are creaks and fissures in the markets.
Remember that the S&P 500 is a market cap weighted index, so larger market cap stocks like Apple and Microsoft carry a much higher weight and influence than stocks 50 through 500, Here is a dispersion chart of the equal weighted S&P 500 by sector for the last 15 weeks, about 4 months. Look closely at this for a second. You will probably be shocked to see the data.
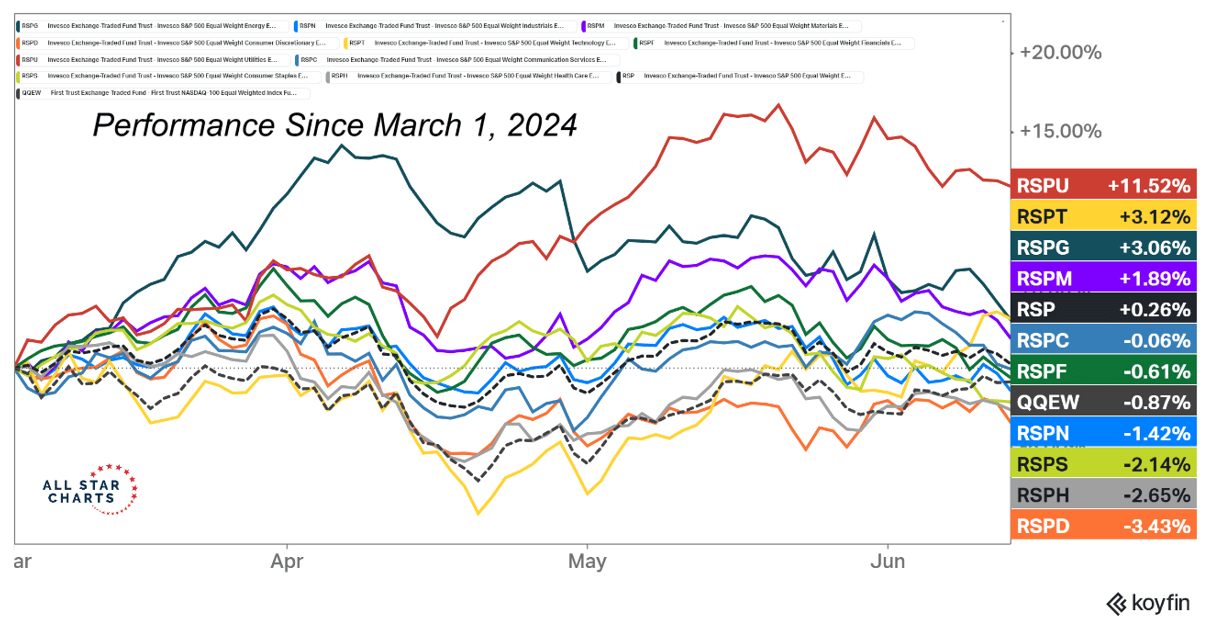
This chart shows the best overall performing sector the last 15 weeks on a breadth basis, which doesn’t adjust for market cap weight, is not technology or telecommunication services but rather, the usually boring utilities sector.
I think few investors see this, and even fewer can explain why it might be happening. This is why I titled this episode, 2024 Stock Markets, Really Interesting. And this is where I pivot for my explanation back to the bond and interest rate markets.
We’ve discussed Nominal Interest rates, those you usually see on TV, the inflation component of interest rates, and “real” interest rates, or the premium and investor requires over inflation to hold a Treasury. Remember the “real interest rate” has a large significance in many investors calculation of equity risk premium and helps determine PE’s. The Fed has a great deal of control over the shorter-term real interest rate in the market when it sets shorter-term borrowing rates. Here’s the math equation again.
Nominal interest rates = Inflation expectations + real interest rate premium
And here is a quick table of each of those components, broken out by Treasury maturity. I’m just pulling the data from Bloomberg, but it’s the real time market data, that’s tradeable as of the weekend of June 16th.
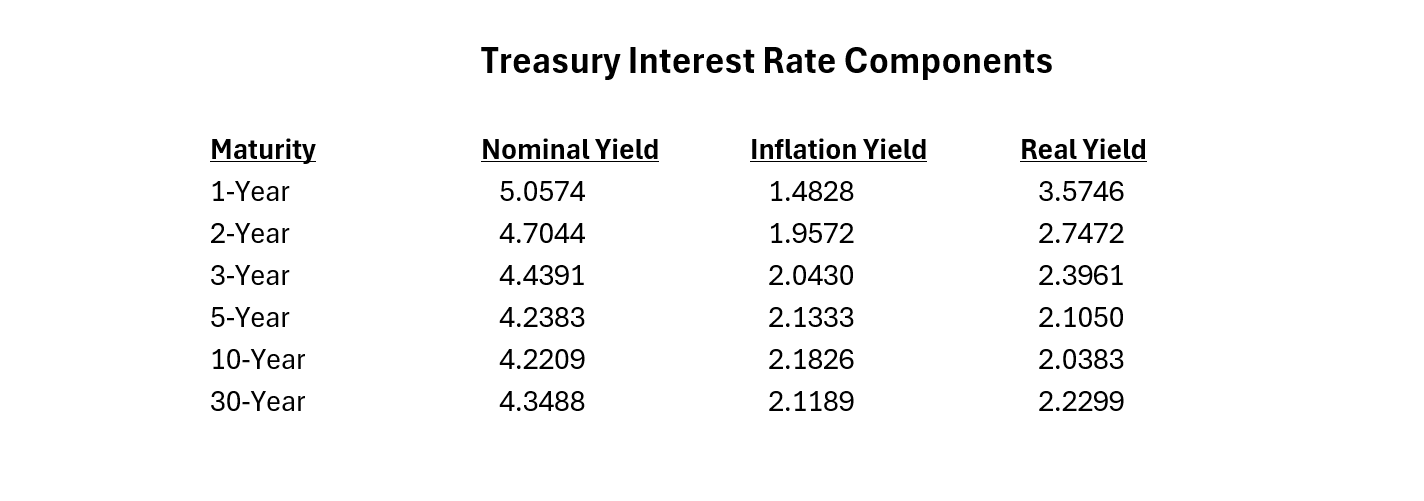
A few quick observations from the table. First, the nominal interest rate yield curve, that is the difference in yield between long term Treasuries and shorter-term treasuries such as the 1 year or even T-bills is inverted. This means that it costs more to borrow money in the short term than it does in the longer term. The situation can exist for a long time, but it is restrictive on bank lending and is one method by which the Fed tries to cool the economy to slow inflation. Historically, yield curve inversions set the clock ticking toward a soft landing or more often an economic recession.
This inversion plays havoc with more highly leveraged companies and smaller bank stocks, which occupy huge weights in smaller cap indexes such as the Russell 2000. The longer this situation exists, the tougher it is on their business prospects. Investors feel content getting paid higher rates over the short term, to just sit and watch and not take on what could be longer term uncertainty.
The second column highlights “real time” market-based inflation expectations. These aren’t numbers calculated by surveys or government employees. This is the current market-based expectations in real time. As you can see by this series, the market’s expectations of future inflation in 5 and 10 years are lower than they currently are. This is saying to investors that the Fed is accomplishing its lower inflation goal. In fact, looking at the 2-year BE inflation number, 1.9572% the Fed is already back to their 2% goal.
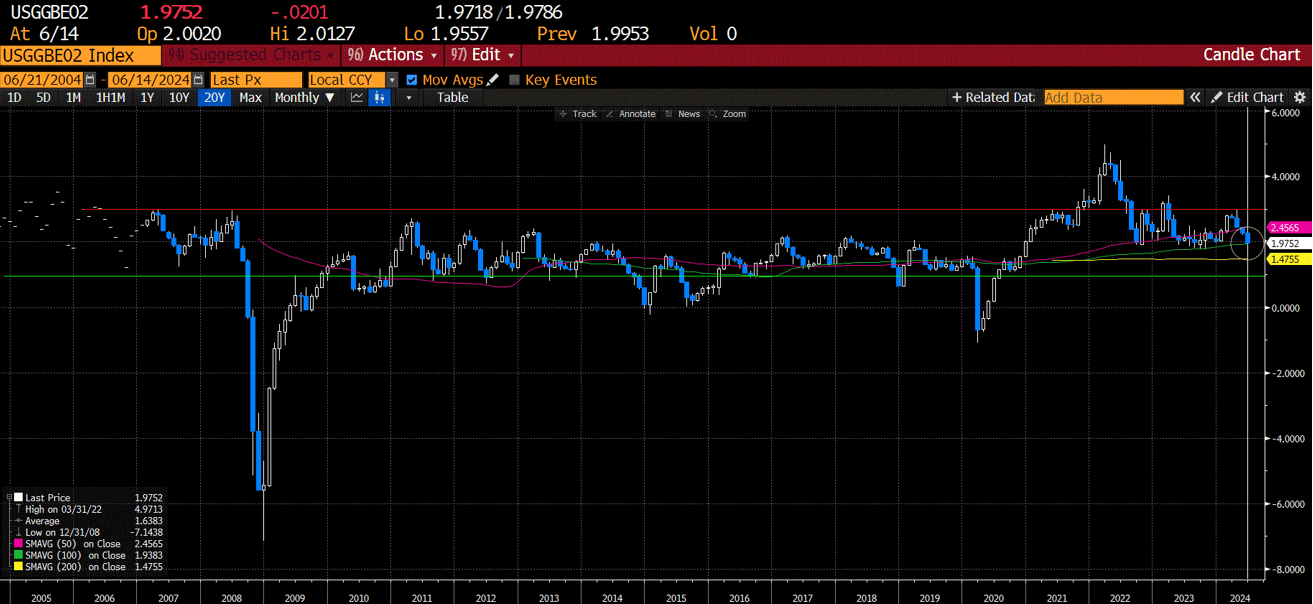
Here is a chart on the 2-year inflation chart dating back 20 years. As one can see, it’s back in its historical range.
If you are still with me, I’m sure you are asking yourself, I thought Chris was going to teach me something about why breadth is so narrow looking year to date in large cap tech and why so few sectors are outperforming.
I believe that answer lies in the last column, the column of real interest rates and more specifically how the real interest rate yield curve is shaped now versus earlier in the year. Remember investors, this really one of the main tools the Fed has to cool inflation, however in doing so, it runs the risk of not just cooling inflation, but cooling the economy too much and either causing a recession or breaking something before they see what’s going on in the real economy.
So, from this table 1-year real rates are over 3.57%, while 10-year real rates are just over 2.03%. 6 months ago, at the beginning of the year, the 1-year real rate was around 2.75% and declined to just under 1% in April but has risen over 250 Bps since. At the beginning of the year, the 10-year real rate was about 1.7%, rose to 2.25% in April and has now declined back to around 2%. So, over the last 6 months, 10-year real rates have risen mildly about 25bps, while short term real rates have risen by 250bps off their lows. That’s the market wrestling and adjusting to the Feds hawkish talk and their “higher for longer” maxim. The Fed has the real interest rate curve inverted in a big way now.
And while this has brought down longer-term nominal interest rates by cooling inflation fears, which has helped the higher growth, low debt leverages large cap mega tech secular leaders like MFST, NVDA, and AAPL stocks as well as utilities which have historically high debt loads and low growth rates, it hasn’t done a thing to help most other sectors. Why? Because sectors like industrials, consumer discretionary and energy are generally shorter cycle areas that move with higher leverage to overall economic swings, both good and bad. And indexes like the small cap, Russell 2000 carry more “value tilted” names, names with higher debt loads, and more overall more cyclicality in their business.
Even the price weighted Dow Jones index, has smaller weight in technology and other sectors that benefit from a tilt lower in longer term nominal yields and their components, inflation and real rates. Indexes like the Russell 2000, have investors waiting to pull the trigger to buy more of them, waiting until the Fed starts messaging a rate cut or until they actually cut rates preemptively so that the economy doesn’t slow too much and tip us into a recession like 2007/08 or the 2h2000 into 2001. Investors, there is a fine line between a “soft landing” and a downturn that morphs into a more serious economic decline and recession that hurts every stock in the market. The Fed’s large inversion of the real-interest rate curve, while slowing inflation, is also finally starting to put the brakes on economic growth that most non-secular growth areas need for their stocks to work, and outside of the normal summer rally, this is where things in the market start to get really interesting.
So, if you’re a retiree or near retirees still watching this video, with volatility in the markets subdued at low levels, and stock returns high for the last 10+years, if over the years you have found yourself reacting emotionally in your portfolio when the markets are down or volatility is high, like into Xmas eve December 2018, or Covid March 2020, or worse yet when markets were down for years post Dot.com bubble or GFC, now is the time to talk to your advisor to walk through your plan. Well in advance of other investors concerns of will the 3q24 be a soft-landing pullback that refreshes, or the beginning of a much more painful economic and market downturn
Discuss how much risk is in your allocation plan under downside market scenarios just in case. Investors, historically there is a 3rd quarter selloff in the markets during election years, just as there is in most every other year. And while most of these selloffs are just cyclical corrections and short-term pullbacks in otherwise long-term bull markets and economic expansions, it is virtually impossible to tell if that selloff is a mild correction in an economic soft landing, or if it’s the beginning of something more dire like it was in 2000 and 2008.
Investors, if you are going to make reallocation decisions to shift money out of stocks and equities into less volatile assets, its best to do it when indexes are up, and volatility is low. Not the other way around.
For investors or retirees who have been fearful that the markets might experience a 1970’s lost decade, a repeat of the lost decade after the Dot.com buildout, or who feel anxiety over the coming election, now is a great time to give Oak Harvest a call. Set up a meeting. Let’s talk.
If you are uncomfortable with wider range of possible equity outcomes, the Oak Harvest team has launched a new strategy that retains the ability to go long stocks, short stocks, as well as buy partial hedges and shock absorber “insurance” for a stock portfolio. Information on this new strategy of ours can be found at www.OakHarvestFunds.com.
From the whole team here, thank you and have a great weekend.
Do you need a retirement plan that goes beyond allocating funds to truly fit your needs? We can help you create a retirement life plan customized for your retirement vision and legacy. Call us at 877-896-0040 or fill out this form for a free consultation: https://click2retire.com/Connect

Chris Perras
CFA®, CLU®, ChFC®
Chief Investment Officer, Financial Advisor
Chris is a seasoned investment professional with over 25 years of experience working with some of the most successful money management firms in the world. Chris has made it a point in his career to adapt as the market landscape changes, seeking to utilize the appropriate investment strategy for a given market environment. His transition from managing billions of dollars at the institutional level to helping individuals and families retire is guided by a desire to see first-hand the impact he is making in the lives of clients at Oak Harvest.
Click to subscribe: