

Dotcom Bubble vs. AI Investment: Could the Federal Reserve “Family Fight” End Today’s Enthusiasm?
The Three Major Points
- Stocks — technology leadership broke, the money didn’t disappear. It moved.
- Interest rates — the Fed controls the short end. The market controls long end.
- The dollar — can tell us whether global money is becoming easier or tighter.
COULD A FED “FAMILY FIGHT”, AND LAST WEEK’S JACKSON HOLE SPEECH, END THE AI PARTY?
For almost two years, we have compared today’s AI investment boom with the Dotcom boom of the late 1990s. And there is good reason. The similarities keep showing up.
Technology spending is booming. Semiconductor stocks had been market leaders.
Investors believe a new technology is going to change the world. Optimism is high because investors expect years of future growth. But history gives us an important warning.
The Internet did change the world. Yet the Nasdaq still peaked in Mid March of 2000.
Why? One big reason was that money became more expensive.
The Federal Reserve had started raising interest rates in 1999. By May of 2000, the Fed funds rate had risen to 6.5 percent. Eventually, that pressure hits aggressive growth stocks.
Technology. The Nasdaq. Semiconductors.
Given last week’s hawkish Jackson Hole Speech, the Federal Reserve may be approaching another important decision point. While the Fed previously voted to keep rates at 3.5 to 3.75 percent, three officials wanted to raise rates. Fed Chairman Kevin Warsh described the debate as a real “family fight.”
And at Jackson Hole late last week, Warsh made it clear that inflation remains too high and that rate increases are possible if the data does not improve substantially.
So today I want to ask a simple question:
Could another Federal Reserve tightening cycle eventually cool today’s AI enthusiasm, just as Fed tightening helped end the Dotcom boom?
And if that happens, where might the money go? Only three points today. Let’s keep it simple.
Stocks. Rates. And the dollar.
POINT ONE — STOCKS: THE DOTCOM BUBBLE ENDED, BUT INVESTING DID NOT
Here is the first lesson. When the Nasdaq peaked in March 2000, investors did not stop investing. They changed what they wanted to own. Technology had been the star.
But technology was also where valuations had become extreme. Back then, Cisco traded near 100 times earnings.Many Internet companies had no earnings at all.
When the cost of money went up, those future profits suddenly became worth less to investors. The Nasdaq peaked first, eventually suffered a drawdown of roughly 74 percent.
As cyclical growth companies, semiconductor and equipment stocks were hit hard.
Your August 28 Stock Talk pointed out that the SOX semiconductor index fell about 18 percent in 2000, another 9 percent in 2001 and another 45 percent in 2002. But something very important happened underneath that crash.
Money moved. Investors began buying companies with earnings, real assets and cheaper valuations. That included what Wall Street likes to call GARP — Growth At a Reasonable Price. It included banks, helped by higher rates. Materials and Miners with high FCF.
Energy companies. And international markets that produced commodities.
So the lesson from 2000 is not simply: Technology peaked and crashed.
The better lesson is: Leadership changed.
VISUAL 1 — WHERE THE MONEY WENT AFTER DOTCOM
The following are approximate returns from post DotCom peak through the next cycle top, from July 2000 through June 2008.
| Asset / Market | Approx. Cumulative Return | Approx. CAGR | Major Drawdown |
| S&P 500 | +20% | ~2% | -45% |
| Nasdaq Composite | -35% | ~-5% | -74% |
| SOX Semiconductors | -60% | ~-11% | -80% |
| U.S. Materials / XLB | +100% | ~9% | -35% |
| Australia | +150% | ~12% | -25% |
| Brazil | +400% | ~22% | -45% |
| Chile | +250% | ~17% | -30% |
| China | +150% | ~12% | -50% |
| Europe | +40% | ~4% | -45% |
| Japan | +10% | ~1% | -50% |
| Gold | +220% | ~16% | -25% |
| Copper | +350% | ~21% | -35% |
| Grains basket | +100%+ | ~9%+ | -30% |
| Global miners | +300%+ | ~19%+ | -40% |
These are approximate comparison figures, not precise investable total-return series.
But look at the message. Overall, Technology lost leadership. Hard assets gained it.
Brazil, Chile and Australia — countries with large commodity industries — did very well.
After the dollar peaked, Gold rose. Copper rose. Mining stocks rose. Materials stocks rose.
That is a completely different investment world than 1995 through early 2000.
WHY DID MATERIALS WIN?
China was a huge reason. China joined the World Trade Organization in late 2001.
Then China started building. Factories. Roads. Railroads. Power plants. Cities.
And eventually a massive infrastructure push ahead of the 2008 Beijing Olympics.
All of that required raw materials. Copper. Iron ore. Steel. Coal. Oil. Cement. Food.
Copper averaged only about 71 cents per pound in 2002, but more than $3 per pound by 2006 and 2007. Much like memory and DRAM prices last year and 1h2026, demand arrived faster than supply. And commodity inflation exploded. But here is the interesting part.
Service inflation and wage inflation remained much more contained.
Cheap manufacturing from China actually helped suppress the price of many finished goods even while raw-material prices soared.
So investors experienced two different inflation stories at the same time. Cheap TVs. Cheap clothing. Cheap manufactured goods. But higher oil prices. Expensive copper.
Expensive steel. Expensive gold. That is why the 2000s became such a powerful decade for hard assets.
POINT TWO — INTEREST RATES: THE FED CONTROLS ONE END; THE MARKET CONTROLS THE OTHER
This is probably the most important difference between short-term and long-term investing. The Federal Reserve controls the short end of the interest-rate market.
Think Fed funds. Overnight money. Very short Treasury bills. Money markets.
But the Fed does not completely control the 10-year Treasury. Overall, The market does. Even though the Fed has intervened many times in the past.
Investors around the world decide what yield they require to lend money to the U.S. government for ten years. That difference became very important after the Dotcom bubble.
WHAT HAPPENED IN 1999 AND 2000?
After the LTCM crisis in 1998, the Federal Reserve cut interest rates. That helped restart markets. Then investors became worried about Y2K.The Fed supplied plenty of liquidity.
Stocks ran higher with the “cherry on top” being the NASDAQ 50%+ run in just the 1q20 alone. But once Y2K passed without a major problem, the Fed changed direction.
Interest Rates rose. The Fed funds rate went from about 4.75 percent in 1999 to 6.5 percent by May 2000. That was a major tightening. And technology stocks cracked. While the Fed controls the Fed funds rate, it’s usually reflected in the 2- Year shorter term Treasury. Here’s the 2 year then and now. Same pattern.
The Dotcom bubble did not end because the Internet was fake; it broke because “the price of the future became too high, while the cost of money rose and liquidity tightened.”
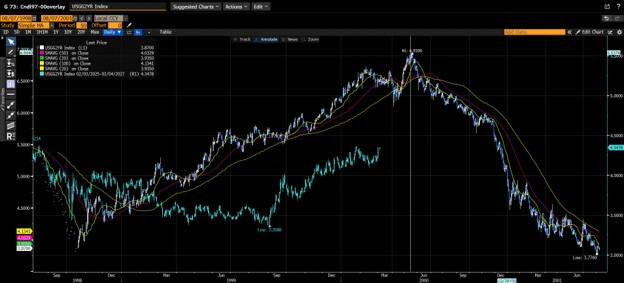
Source: Bloomberg
That is the lesson worth remembering.
BUT THEN SOMETHING DIFFERENT HAPPENED
The Fed eventually started lowering short-term rates. Yet longer-term interest rates did not always follow exactly. Why? Because the bond market was watching something different.
Economic growth. Commodity inflation. Federal borrowing. Global demand for U.S. bonds.
And eventually housing and credit risk. So investors need to watch two interest rates, not one. Fed funds tells us what the central bank is doing. The 10-year Treasury tells us what the bond market thinks.
NOW LOOK AT 2026
Today, Fed funds sits around 3.5 to 3.75 percent. But the Federal Reserve was divided.
Three members wanted higher rates at the July meeting. After Jackson Hole, markets increased the odds that the Fed could raise rates again in September because inflation remains sticky. That creates our potential Dotcom rhyme. If the Fed raises short rates while the 10-year Treasury stays high — or rises further — the cost of money goes up from both directions. And which stocks usually feel that first?
Long-duration growth stocks. Technology. Semiconductors. Companies whose valuations depend heavily on profits many years into the future.
That does not mean AI ends.The Internet did not end in 2000 either.
It means the price investors are willing to pay for future growth can change.
POINT THREE — THE DOLLAR: WATCH THE WORLD’S FINANCIAL PRESSURE GAUGE
The third point is the dollar. The dollar sometimes gets ignored by individual investors.
It should not. Think of the dollar as one of the world’s financial pressure gauges.A headwind or tailwind. A stronger dollar often means financial conditions are getting tighter around the world.
Why? Because many commodities are priced in dollars. Much global debt is borrowed in dollars. And international companies compete against U.S. companies through exchange rates.
DOTCOM PERIOD
During much of the late 1990s, the dollar was strong. Money flowed toward the United States. America had the hottest stock market. The strongest technology companies. Here’s the dollar chart then and now overlaid.
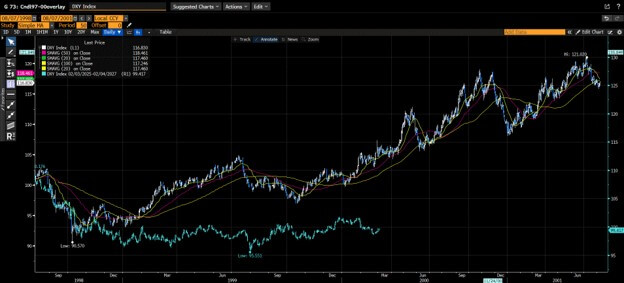
Source: Bloomberg
Strong economic growth.And attractive interest rates. That combination pulled international capital into U.S. assets. But after the technology bubble broke, leadership broadened outside the United States.
Commodity-producing countries became much more attractive. Brazil. Chile. Australia.
Emerging markets. Materials companies. Miners. A weaker dollar later helped amplify many of those moves because commodities priced in dollars became more valuable in dollar terms.
WHY THIS MATTERS TODAY
Today, watch the same three things together: Technology stocks. Interest rates. The dollar.
If tech weakens while Treasury yields rise and the dollar strengthens, that would look like tighter financial conditions. That would be a yellow light for expensive growth stocks.
But if technology leadership slows while the dollar falls and commodity prices strengthen, that could create a very different outcome. Money might simply rotate.
From digital assets —to physical assets.From AI hardware —to the copper, steel, uranium, electricity and equipment needed to build AI infrastructure.
That is exactly the argument from our August 28 Material World discussion: AI itself may create demand for the next leadership cycle through power, grids, copper, steel, natural gas, nuclear fuel and electrical equipment.
FIVE SIMILARITIES — DOTCOM VS. AI
- A TECHNOLOGY REVOLUTION
1998 through 2000: The Internet.
2025 through today: Artificial intelligence.
Both technologies promised to change how businesses work and how people live.
And both attracted enormous amounts of capital.
- STOCK-MARKET LEADERSHIP
In both periods, technology led the market. The Nasdaq outperformed.
Semiconductors became critical. The SOX became one of the most important indexes to watch. And a relatively small number of technology companies drove a very large amount of market performance.
- CAPITAL-SPENDING BOOMS
Dotcom required:Fiber.Routers.Servers.Telecommunications equipment.Semiconductor fabs.
AI requires:GPUs.Memory.Networking.Data centers.Power.Cooling.Electrical grids.
The infrastructure is different.The pattern is similar.
- RISING COST OF MONEY
In 1999 and 2000, Fed tightening eventually challenged technology valuations.
In 2026, inflation has again limited how easy the Fed can be.And now Chairman Warsh is openly allowing a much bigger debate inside the Fed. That “family fight” matters because markets now have to consider the possibility that the next Fed move could be up, not down.
- EVEN POP CULTURE RHYMES
Here is my favorite coincidence. The 1999 NBA Finals: San Antonio Spurs versus New York Knicks. The Spurs won four games to one. The 2026 NBA Finals:San Antonio Spurs versus New York Knicks again. This time the Knicks won four games to one and captured their first championship since 1973.
Same two cities. Same Finals matchup.Opposite winner.That may be the perfect metaphor for financial markets.History can rhyme without giving you the same ending.
FIVE IMPORTANT DIFFERENCES
- TODAY’S AI LEADERS ACTUALLY MAKE MONEY
This is probably the biggest difference. Many Dotcom companies had no earnings.
Some barely had revenue.Today’s major AI companies generate enormous revenue, earnings and cash flow.
Today’s risk is less about companies with no business model and more about profitable companies and a few private companies spending so much on AI that future returns on capital may disappoint.
- THE FED CYCLE IS DIFFERENT
In 1999, the Fed was clearly tightening. Today, the Fed is now debating whether rates need to rise again. Same risk. Different starting point.
- ECONOMIC GROWTH WAS STRONGER IN 1999
The late 1990s economy was booming. Real GDP growth exceeded 4 percent in both 1998 and 1999. Today economic growth remains positive, but it is not the same broad-based late-1990s boom. That said, a meaningful piece of current growth is tied directly or indirectly to AI capital spending.
- INFLATION LOOKS DIFFERENT
Dotcom-era inflation began from very low levels. Today, investors are coming out of the largest inflation shock in decades.Energy remains important. Oil remains important.
And the Fed has less room to simply ignore inflation risk.
- THE GEOPOLITICAL BACKDROP IS MUCH HARDER
The late 1990s had geopolitical problems. Kosovo.Russia.Asian financial stress.
But today’s list is much longer. Iran and the Middle East. Russia and Ukraine. China and Taiwan. Trade restrictions. Tariffs, Supply-chain, nationalism, Defense spending, Energy security, That makes hard assets potentially more important today than they were during much of the late 1990s.
CLOSE — THE NEXT WINNER MAY NOT BE YESTERDAY’S WINNER
So let me leave you with this.The Dotcom bubble did not end because the Internet failed.
The Internet won. The stocks lost. Those are two very different things. And after the technology bubble ended, investing did not end. The money moved toward lower valuations. Toward GARP. Toward financials. Toward international markets.
Toward materials. Toward miners. Toward commodities. That leadership shift lasted for years.
Could that happen again?Absolutely.But it does not have to happen tomorrow.AI earnings are still strong.AI capital spending is still strong.And today’s technology leaders have much stronger businesses than many of the companies we owned — or avoided — back in 1999.
But I would watch three things very closely from here.
Number one: stock-market leadership.
Does the Nasdaq and SOX keep leading, or does leadership broaden toward materials, financials and hard assets?
Number two: interest rates.
Does the Fed raise the short end? And does the 10-year Treasury rise with it?
Number three: the dollar.
Does it strengthen and tighten global financial conditions? Or weaken and give commodities and international markets another tailwind? Because the biggest lesson I learned managing money through the Dotcom era is very simple:
You can be completely right about the technology — and completely wrong about which investment wins next. And maybe those NBA Finals gave us the perfect reminder.
1999: Spurs four, Knicks one. 2026:Knicks four, Spurs one. Same teams.
Different winner. Financial markets can work exactly the same way. History may rhyme.
But leadership changes. And when the Federal Reserve starts having a family fight over interest rates, investors should probably pay attention. I’m Chris Perras.Thanks for watching Stock Talk.
General information only — not financial advice.
Chris Perras
CFA®, CLU®, ChFC®
Chief Investment Officer, Financial Advisor
Chris is a seasoned investment professional with over 25 years of experience working with some of the most successful money management firms in the world. Chris has made it a point in his career to adapt as the market landscape changes, seeking to utilize the appropriate investment strategy for a given market environment. His transition from managing billions of dollars at the institutional level to helping individuals and families retire is guided by a desire to see first-hand the impact he is making in the lives of clients at Oak Harvest.
Click to subscribe: