

Living in a Material World: After AI (Dot-Com), What Might Be Next? Stock Talk Update August 28, 2026
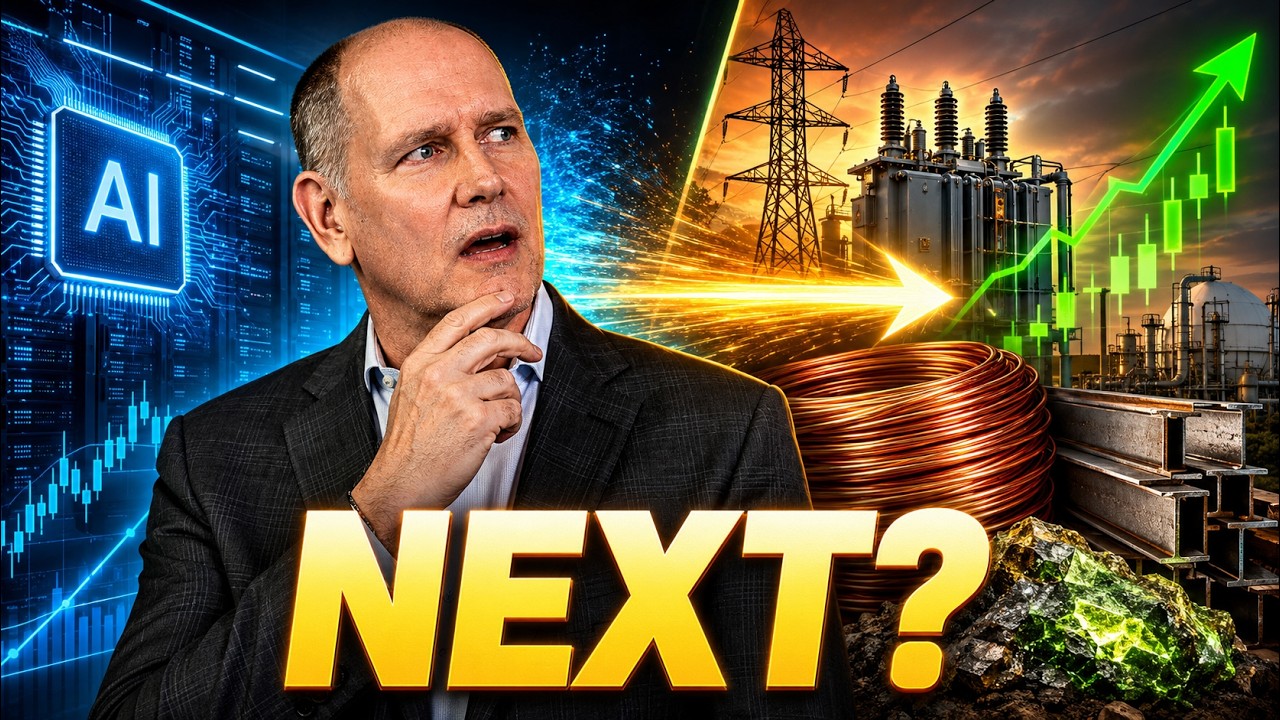
The Three Major Points
| 1. Leadership changes | 2. AI may become industrial | 3. Follow the money |
| After Dotcom 2h2000+, technology topped first as interest rates rose. Investors moved toward GARP, materials, miners and commodity markets. | China powered the 2000s supercycle. A Supercycle 2.0 could be broader: AI, grids, electrification, deglobalization, defense meet constrained supply. | The key question is not if AI disappears. It is what the next leadership groups would become, the physical inputs AI and the global economy must buy. |
WHAT COMES AFTER AI?
For almost two years on at Oak Harvest and on Stock Talk, we’ve spent a lot of time talking about AI.
AI chips. Data centers. Semiconductors. Electricity. And hundreds of billions of dollars of capital spending. Who wins, who loses. Who spends. Who receives.
But today I want to ask a different question: What comes AFTER AI? First, I’m not saying AI is ending tomorrow or in 2026. I’m asking something investors should always ask: If today’s stock market winners slow down or even stop winning — where might the money go next?
I’m old enough to have seen this movie before. After the dot-com top in late 1q2000, technology stocks stopped leading. But the stock market didn’t disappear. Leadership changed. Back then, pretty dramatically because the Federal Reserve brought down the hammer in 2000 when Y2K proved a non-event.
And for roughly the next six years, some of the biggest winners weren’t companies selling software, hardware or chips. They were companies selling stuff: copper, steel, gold, oil, chemicals and mining equipment.
In other words, we started living in Mohanna’s world, a Material World.
Why does this history matter today? Because basic materials have started showing better relative strength just as semiconductor leadership has cooled. Jesse Colombo’s recent Bubble Bubble Report also points out that XLB, the S&P 500 materials ETF, has been near one of its lowest RS versus SPY since the 2000.
Janus Henderson takes the idea one step further. Their natural-resources team argues that a broader ‘Supercycle 2.0‘ may be emerging, driven by deglobalization, decarbonization, demographics and AI, all while years of underinvestment and overreguation constrain new supply.
Today, just three points.
POINT ONE — WHEN TECH TOPPED, MONEY DIDN’T DISAPPEAR. IT MOVED.
Here’s our first history lesson. The Nasdaq peaked on March 10, 2000. But the Federal Reserve had already been raising interest rates. The Fed funds rate moved from 4.75 percent in mid-1999 to 6.5 percent by May 2000. Money was becoming more expensive, and expensive money was especially painful for companies whose profits were supposed to arrive years in the future.
Technology stocks peaked first. Semiconductors got hit particularly hard. The Nasdaq ultimately suffered about a 74 percent peak-to-trough drawdown. The SOX semiconductor index fell 18 percent in 2000, another 9 percent in 2001 and another 45 percent in 2002. Now we aren’t saying we will repeat that disaster, as the Fed is more market focused nowadays that then.
But something important happened underneath those numbers. Investors started looking somewhere else.
They looked for earnings, real cash flow and reasonable prices elsewhere. That’s where the old Wall Street phrase GARP comes from: Growth at a Reasonable Price. Banks improved. Industrials improved. Materials began a huge cycle. International markets, especially countries producing commodities, started outperforming. Technology didn’t disappear. Leadership changed.
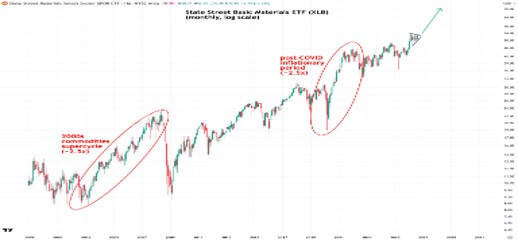
And now we have an interesting parallel. Looking at a long-term XLB chart shows two major materials advances, one during the 2000s commodity supercycle and another after the COVID inflation shock. The XLB rose roughly 2.5-fold during both episodes.
VISUAL 1: XLB — Materials Have Done This Before.”
Source: Jesse Colombo, The Bubble Bubble Report, Aug. 9, 2026
Look at that first big move. That’s what happened after the dot-com bubble. Technology stopped being the only game in town. Materials became one of the new games. What caused this boom in commodities?
POINT TWO — CHINA BUILT THE LAST SUPERCYCLE. COULD AI BUILD THE NEXT ONE?
Why did hard assets become so powerful after 2000-02 through 2008? One giant reason was China.
China joined the World Trade Organization in late 2001, then built at an incredible speed: factories, roads, railroads, power plants, cities and eventually enormous infrastructure ahead of the 2008 Beijing Olympics.
All that building required stuff. Copper for wiring. Steel and iron ore for buildings. Oil for transportation. Coal for electricity. And food for a population getting richer. Dr. Copper tells the story. Its annual average price was only about 71 cents a pound in 2002. By 2006 it averaged roughly $3.05, and in 2007 about $3.23 — more than four times the 2002 price. As in most commodities, Demand arrived faster than supply. And that is the basic recipe for a commodity supercycle. Just look at what just happened in commodity semiconductors the last 18 months, in memory prices and memory stocks like Micron and Samsung.
LiteFinance makes the idea easy to understand: a normal business cycle may last only a few years, but commodity cycles can last much longer because mines, processing plants and infrastructure take years to finance, permit and build. You think building a semiconductor chip plant takes time? You can’t build a copper mine like you download an app.
The old supercycle was mostly China builds, commodities rose. The next one could have 4 demand engines at once: deglobalization, electrification, demographics, and artificial intelligence.
And the supply side is starting from an unusual place. Janus says mining capital spending remains around 30-year lows, meaning a sustained investment cycle may be needed not only in mines but also refining, processing and manufacturing infrastructure.
The demand story is already improving, but the starting valuation for resource equities is still relatively inexpensive versus broader global equities. That matters because starting price can shape future returns. A cheap asset can stay cheap, but it gives investors more room for good news.
Recently, S&P Global Natural Resources Index returned 29.7 percent in 2025 versus 22.9 percent for the MSCI All Country World Index. That is not proof of a new supercycle, but it is evidence that the leadership shift may already be showing up at the margin.
THE AI → MATERIALS CHAIN
Here’s the chain I want viewers to remember: AI capex creates power demand. Power demand creates grid investment. Grid investment creates demand for copper, steel, transformers, natural gas, nuclear fuel and electrical equipment. If supply cannot expand quickly enough, scarcity can push prices higher.
VISUAL 2 — IEA DATA-CENTER ELECTRICITY DEMAND
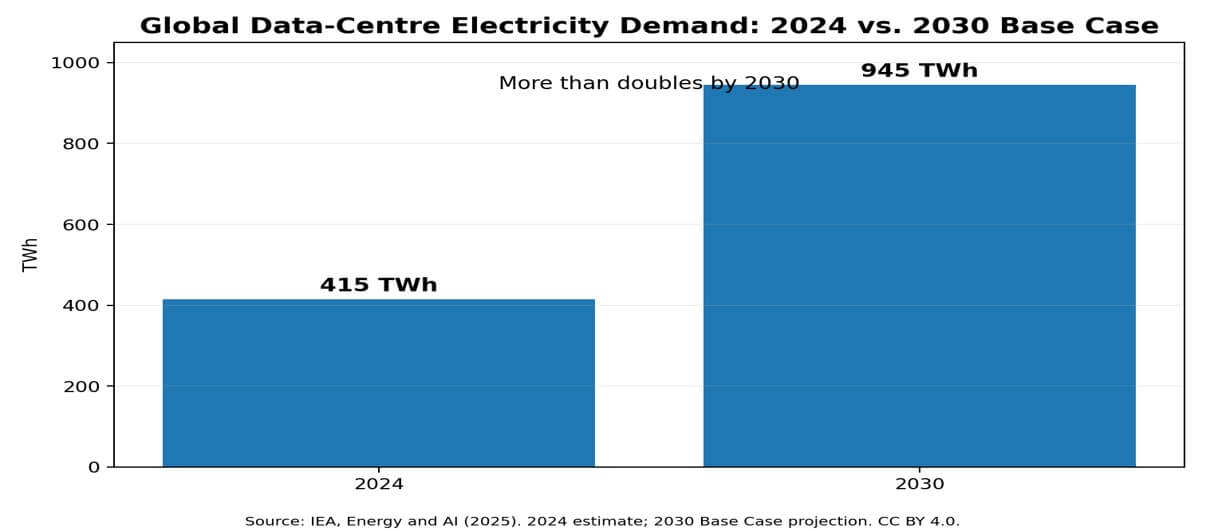
This IEA chart is one of the clearest bridges between the digital AI story and the physical materials story. Global data-center electricity use was about 415 terawatt-hours in 2024. The IEA Base Case projects roughly 945 terawatt-hours by 2030 — more than double in only six years. The IEA says data-center electricity demand grows around 15 percent per year from 2024 to 2030, while electricity use from accelerated servers — the hardware most closely tied to AI, grows around 30 percent per year.
And the electrical grid cannot move at software speed. A data center can be operational in two to three years, while the broader energy system often needs longer lead times for planning, permitting and construction. That timing mismatch is exactly where commodity bottlenecks can develop.
POINT THREE — FOLLOW THE MONEY
Here’s the historical picture I want you to remember. After dot-com, the old stock market leaders struggled while many materials, commodity-producing countries and hard assets produced much stronger returns.
VISUAL 3— AFTER DOT-COM: WHERE THE MONEY WENT (July 2000–June 2008 historical framework)
| Asset / Market | Approx. cumulative return | Approx. CAGR | Major drawdown |
| S&P 500 | ~+20% | ~2% | ~-45% |
| Nasdaq Composite | ~-35% | ~-5% | ~-74% |
| SOX Semiconductors | ~-60% | ~-11% | ~-80% |
| U.S. Materials / XLB | ~+100% | ~9% | ~-35% |
| Australia | ~+150% | ~12% | ~-25% |
| Brazil | ~+400% | ~22% | ~-45% |
| Chile | ~+250% | ~17% | ~-30% |
| China | ~+150% | ~12% | ~-50% |
| Europe | ~+40% | ~4% | ~-45% |
| Japan | ~+10% | ~1% | ~-50% |
| Gold | ~+220% | ~16% | ~-25% |
| Copper | ~+350% | ~21% | ~-35% |
| Grains basket | ~+100%+ | ~9%+ | ~-30% |
| Global miners | ~+300%+ | ~19%+ | ~-40% |
Approximate comparison figures.
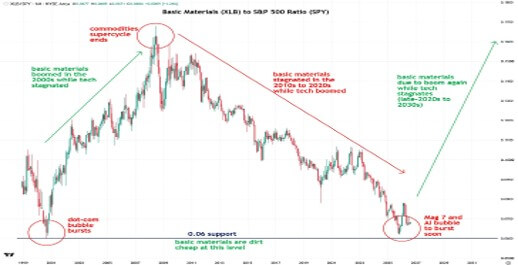
Now look at today. Natural resources outperformed global equities in 2025 and again this year with oil, while the XLB-to-SPY chart shows materials have underperformed the broad U.S. market for roughly 17 years.
VISUAL 4: XLB RELATIVE TO SPY – Materials Cheapest Relative Level Since the 2000
Source: Jesse Colombo, The Bubble Bubble Report, Aug. 9, 2026.
That does not mean materials have to outperform tomorrow or every week or month. Cheap things can stay cheap. But it does mean the starting point is very different from the tech sector after years of strong returns.
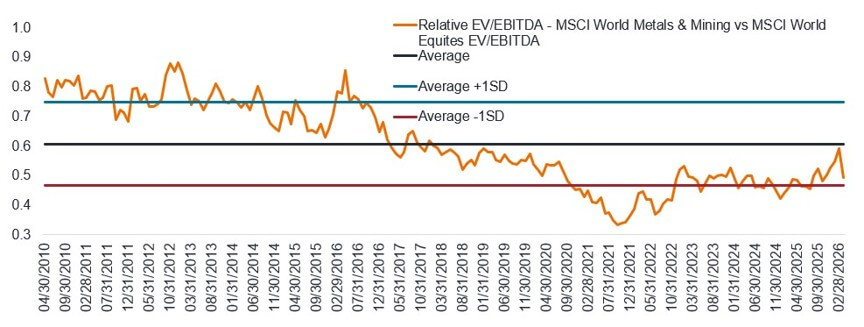
Source: Janus Henderson
THE MOST IMPORTANT DIFFERENCE
There is one big difference between the old supercycle and a possible new one. The old one was overwhelmingly China builds, commodities rise. The next one could be the world builds, commodities rise. China is no longer experiencing the same urbanization boom that powered the last cycle. That is a real difference against simply repeating the 2002-to-2008 playbook. China’s growth is slowing fast and they have excess capacity in most areas. But today the demand base may be broader: AI, electric grids, defense spending, domestic manufacturing, energy security, electrification, new supply chains and growing emerging economies. However, there is good news.
Supercycle 2.0 does not need China 2.0. It needs many structural demand engines hitting an industry that has not built enough supply.
CLOSE — COULD AI CREATE ITS OWN SUCCESSOR?
The thing that comes after AI might actually be created by AI. We’ve spent decades moving toward an economy built around things you can’t touch: software, cloud computing, social media and digital advertising.
But AI is forcing technology companies back into the physical world. They need buildings, chips, copper, power, cooling, natural gas, nuclear power, electrical equipment and enormous amounts of capital.
So here’s the sequence we are watching: AI capex. Then power demand. Then grid buildout. Then resource scarcity. Then, possibly, higher commodity prices. This is not a prediction. It is a road map of what to watch.
And the road map can fail. AI spending could slow. Technology could become far more energy efficient. China could weaken further. New commodity supply could arrive faster than expected. Or a recession could knock demand down before scarcity becomes serious. That’s why we watch the data.
But here is the investment lesson from 2000: the winner of one cycle does not have to be the winner of the next cycle. After dot-com, investors who kept looking only at yesterday’s technology winners missed some of the biggest trends of the following six years.
So as this AI cycle matures, we are watching something besides Tech and the Nasdaq. We are watching what AI has to buy. I’m watching XLB relative to the S&P 500. I’m watching copper. I’m watching miners.Apparently a lot of others started watching last week as well. I’m watching power demand and the electrical grid.
Because after spending years living in a digital world — we may be heading back toward a Material World.
Final line: “Great technology changes the world. But sometimes the next great investment isn’t the technology itself — it’s the material needed to build that new world.”
There’s no obligation. We’ll learn more about your goals, income needs, and concerns and help you understand whether there may be opportunities to improve your retirement plan. https://click2retire.com/lets-connect(opens in new tab)
Sources / Data Notes
- International Energy Agency, Energy and AI (2025): global data-center electricity demand estimated at ~415 TWh in 2024 and projected at ~945 TWh in the 2030 Base Case; ~15% annual growth; accelerated-server electricity use ~30% annual growth.
- Janus Henderson Investors, “Global natural resources: Structural tailwinds driving the next commodities supercycle,” Mar. 26, 2026: Supercycle 2.0 framing; mining capex near 30-year lows; S&P Global Natural Resources USD Index +29.7% in 2025 vs. MSCI ACWI +22.9%; resource equities described as attractively valued relative to broader equities.
- Jesse Colombo, The Bubble Bubble Report, “An Exciting Opportunity in Basic Materials,” Aug. 9, 2026: XLB long-term and XLB/SPY relative charts; materials composition and relative-strength thesis.
- LiteFinance, “Commodity Supercycle”: general explanation of long commodity cycles and slow supply response. Used as explanatory background, not as a primary market-data source.
- Historical return table an approximate.

Chris Perras
CFA®, CLU®, ChFC®
Chief Investment Officer, Financial Advisor
Chris is a seasoned investment professional with over 25 years of experience working with some of the most successful money management firms in the world. Chris has made it a point in his career to adapt as the market landscape changes, seeking to utilize the appropriate investment strategy for a given market environment. His transition from managing billions of dollars at the institutional level to helping individuals and families retire is guided by a desire to see first-hand the impact he is making in the lives of clients at Oak Harvest.
Click to subscribe: