


You Get What You Pay For: Stock Market Update, Friday December 5, 2025
Almost everyone I know likes a Deal. A good Black Friday savings deal. Maybe a 20-30% off sale or discount. Unfortunately, when it comes to the stock market, more often or than not, over the long term, you get what you pay for. While the overall S&P 500 has average around 10% per year over the last 100 years and around +15% per year the last 5 years, the annual return profile is far from linear each and every year. If you invest long enough, you likely endure unrealized losses and downside volatility of varied sizes each and every year if you are invested in the S&P500 or any other index. The reward for investing in equities is the return. The “risk” is enduring the downside volatility at times. Here’s some great data from Charlie Bilieo on annual drawdowns and their frequency. Look at the above chart. -5% decline in the S&P500 happens nearly every year, while a -10% decline happens, twice that rate, happens nearly every year and a half. The treaded bear market decline of -20% happens a little over once every 4 years while a recessionary decline of -30% happens 1 out of 10 years. Investors, if you invest long enough, expect at some point during your lifetime that the S&P500 will lose half its value. Given its rarity, let’s call that a generational decline. Even within the S&P 500 there is a wide discrepancy of where this annual return comes from. Over the last few decades, higher quality, high marginal return on invested capital companies that are growing faster or more consistently have tended to outperform lower growth, higher indebted companies. However, with this growth profile, often comes a higher level of annual variance in stock returns. We’ve seen this dynamic play out over the last few years post Covid shutdown. Many times, clients and prospects have expressed “all I want is higher returns with less volatility”. Yes, we educate them, that’s not how investing in public equities work. I wish it was that simple. Unfortunately,…

Technology Adoption Cycles: The AI Capex Spending Tsunami
Before getting into this week’s topic, which is making front page financial headlines week after week right now, the AI technology Capital Expenditure Tsunami, we hope you had a peaceful and thankful Thanksgiving yesterday. Over the past 10 years, the stocks of seven large technology companies: Alphabet, Amazon, Apple, Meta Platforms, Microsoft, Nvidia, and Tesla have performed so well and grown in such size they have been grouped into a universe now known as the Magnificent 7, or Mag 7 for short. The Mag 7 stocks have as a group significantly outperformed the rest of the S&P500. Since 2015, these 7 stocks have a combined return of almost 27.5% per year largely due to extraordinary high revenue growth, high margins and high operating profit per employee on the back of being relatively “asset light”. However, recently the Mag 7 cohort has ramped capital spending ramping significantly. And this spending habit shows no signs of slowing as they are projected to continue to spend aggressively on chips, racks, servers, electricity, and real estate into the near future. As they spend more, they shift from asset light to more asset heavy and the risk overinvestment and lower marginal ROIC grows with it. Meta, Microsoft, and Alphabet are each set to spend between 21 and 35% of their revenue on capex in the next few years. Combined, the 7 are estimated to spend almost $400 billion per year the next few years and if Jensen Huang from Nvidia is correct that number might be understated and closer to $500 billion per year. Big Tech’s AI spending is currently so large that it is helping the broader economy, accounting for an estimated half of U.S. GDP growth so far this year. Per Carson group, a chart on the incremental GDP from Tech spending. You can see this is spend level is now currently above incremental GDP contribution during the late 90’s Dot.com capex boom. Why the recent concerns? Past infrastructure spending booms have taught investors that the path to sustainable revenue is often offset by…
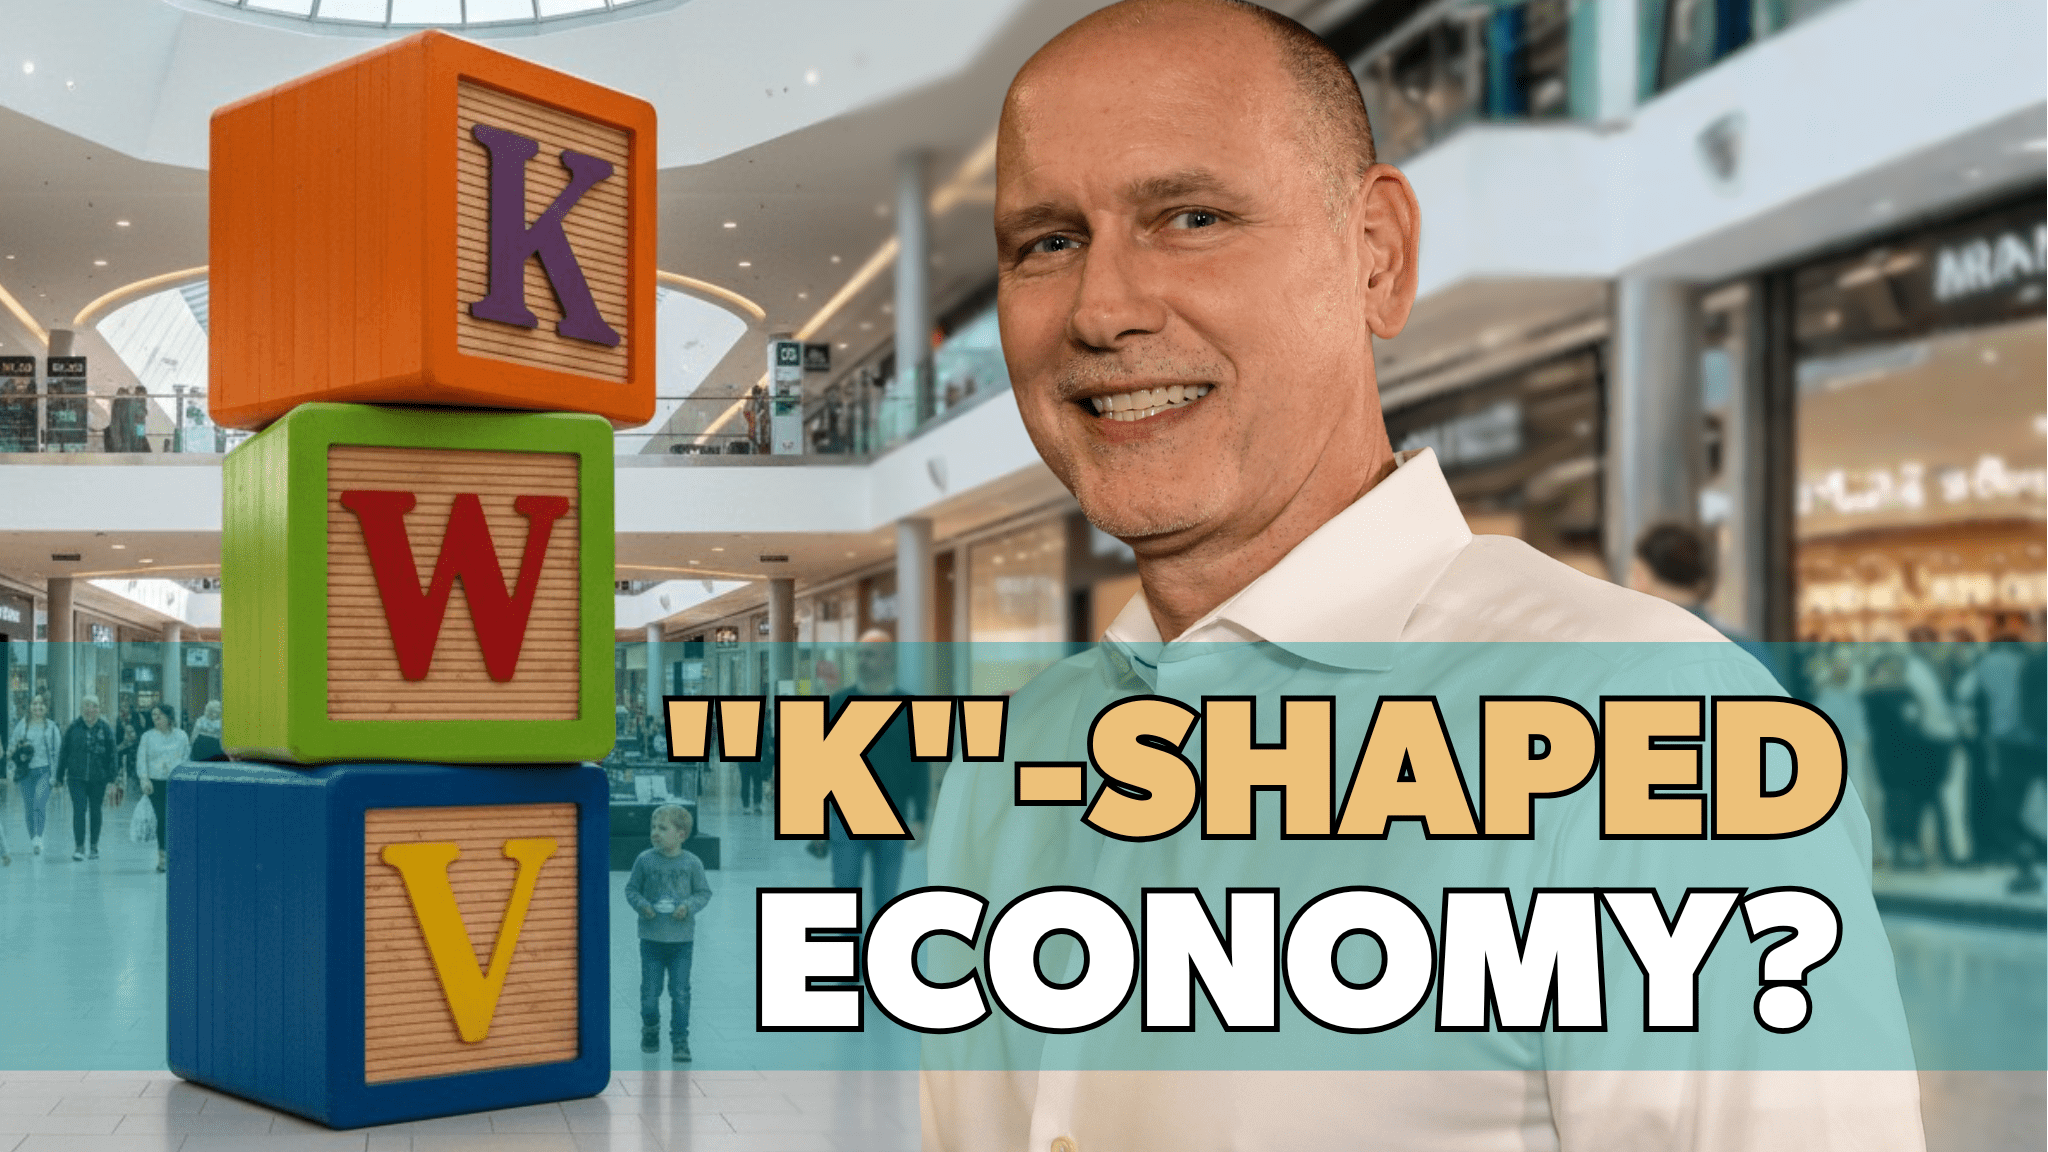
What is a “K”-Shaped Economy? Stock Market Update, Friday November 21, 2025
I think, in bit of an attempt to make economics more understandable to the masses, many financial commentators have over the years tried to reduce pretty complex economic theories into basic shapes, or nowadays a single letter in the alphabet. First there was the V”-shaped economy that was meant to show a steep decline into recession, but an equally as fast recovery out. There was the “double dip” economy designated by a “W”, where the economy shrank into recession, began to grow, slipped back into a brief contraction only before picking up speed again on the growth side. Most recently, many in the economics world have introduced a new shape and letter into our financial lexicon. The letter K. This letter is being used to describe an economic recovery where different demographic groups experience different results. Unlike a V-shaped recovery where theoretically everyone gains equally or at least at least at the same rate. The K means, some areas do well and gain, while others suffer and decline, leading to a divergence in wealth and opportunity. In the current K-shaped recovery, the overall GDP of our economy is growing, currently at 3-4%, but it’s highly concentrated and fewer workers believe they are benefiting. Currently the “AI” infrastructure buildout is accounted for a large proportion of incremental GDP growth. That infrastructure spending is helping drive up a number of large cap tech stocks that are heavyweights in the S&P500. At the same time, this capex spending is contributing to a continued higher level of prices on energy and materials. At the same time, layoffs at a number of larger tech companies is causing a great deal of job anxiety to college students graduating and entering the workforce as well at workers making $100-250k per year who are fearing that AI automation will eliminate their jobs. Currently, those individuals with larger stores of wealth, fixed assets like houses and investment assets like stocks, might feel pretty good about the economy while many others who don’t have savings or larger stores of fixed…

Our Song Remains the Same: Stock Market Update, Friday November 7, 2025
I was born in 1965, love classic rock and most 70’s and 80’s rock bands, but theres a special place in my heart for Led Zeppelin. The icon rock band led by Robert Plant, Jimmy Page, John Bonham, and John Paul Jones. No not the retired legendary trader Paul Tudor Jones, who we’ve called out many times the last 5 years for being chronically misguided in the direction and taming of his stock market calls. Paul Tudor Jones, has said that we are in late 1999 replicating the near end of the Dot.com bubble. My view, I doubt that’s the case. I doubt we are in the 9th inning as he suggested, and the party is good enough to hang around but one should look to quickly exit. We covered this material multiple times over the past 6 months. Lately there has been quite a lot of negative talk about the market being overbought and breadth deteriorating, or many bears discussing a “dire”, their term, reduction in bank liquidity. Every few week the bears have tried to latch onto these and other so called “critical” topics to explain why the “end is near” for this bull market and V-bottom rally. Even though I cant find any of them who said buy, 7 months ago at 5100 on the S&P500 during the Trump Tariff tantrum. This rally has left most bears and many hesitant investors “dazed and confused”. Our team has been here since mid-April with a ”whole lotta love” for our clients believing in the rally as it has climbed a venerable “stair way to heaven” to 6850 into the end of October. Up here, bears are trying to convince you that it’s a “misty mountain top” in the market, and while our work does suggest there can be more turbulence in November than in the last 6 months, with the possibility of retesting both the 50 rising 50 day and 100 days moving averages, “Our song remains the same “ at OHFG. It’s been a V-bottom since early April…

AI Tech Stock Bubble? Stock Market Update, Friday October 24, 2025
Maybe 5 or 10 years from now investors will look back and cry about the 21 trading days in September of 2025 as the 9th inning of the AI tech stock investment bubble like Paul Tudor Jones has recently suggested. Paul Tudor Jones, has said that we are in late 1999 replicating the near end of the Dot.com bubble. My view is I doubt that will be the case. I doubt we are in the 9th inning as he suggested, and the party is good enough to hang around but one should look to quickly exit. First off, I flat out don’t see the comparison to the 3rd quarters during 1998-20 Dot.com run. The data says otherwise. In fact, the 3rd quarter stock returns was negative each of those years. In PTJ analogy, its early 4q99. I can’t disagree more. In the summer of 1999, the S&P 500 was down -6.69% not up +7.6%+ like we just were in 3q25. Here’s the seasonal table for the S&P500 throughout the Dot.com internet buildout for you to make your own decision. PTJ was a world best trader in his days, however I would argue that like most of the retired billionaire HF managers I have heard on financial TV for 5-10 years, most all of their advice has been ill timed or just flat out wrong. They don’t trade the way they did when they were making their fortunes. If you have been following our videos, we’ve been discussing the Dot.com internet build versus the AI buildout analogy for well over a year and our team has been increasingly positive on it since the mid-April stock market V-bottom this year. Others have been trying to scare you about the comparison in a negative way and about it being a “bubble”. My question to them is, if you are so good at spotting bubbles, why haven’t you been long and investing in it taking advantage of it as you are probably equally as good at getting out on the other side? This might…

4Q25 Outlook: “Let’s Get it Started” – V-Bottom Month 7. Stock Market Update, Friday October 17, 2025
Maybe 5 or 10 years from now investors will look back and cry about the 21 trading days in September of 2025 as the top of the AI bubble. My view is I doubt that will be the case that we’ve seen the top. Moreover, I also disagree with the recent calls from the like of the legendary trader Paul Tudor Jones, that we are late 1999 replicating the near end of the Dot.com bubble. Yes investors, we just got through a near historic 3q for stocks, particularly the combined positive returns of August and September which historically amount to nothing “net” over the 2 months with Augusts up return being most often erased by a down September. Here is a chart from Carson showing 3rd quarter returns since 1970. First off, I flat out don’t see the comparison to the 3q quarters during 1998-20 Dot.com run. The data says otherwise. In fact the 3rd quarter was negative each of those years. In fact in PTJ analogy, its early 4q99. I can’t disagree more. In the summer of 1999, the S&P 500 was down -6.69% not up +7.6%+ like we just were in 3q25. Here’s the seasonal table for the S&P500 throughout the Dot.com internet buildout for you to make your own decision. PTJ was a world best trader in his days, however I would argue that like most of the retired billionaire HF managers I have heard on financial TV for 5-10 years, most all of their advice has been ill timed or just flat out wrong. They don’t trade the way they did when they were making their fortunes. I mean it doesn’t take much of a Google or Gemini search to see that PTJ has been negative for years and as recently as May, PTJ was saying the S&P 500 would fail to rally and take out its April Tarriff tantrum lows regardless of a Tarriff truce. The S&P 500 rallied over 23% in the 5 months since his call. Nearly in a straight line. With very…

A September to Remember: 21 Trading Days. Stock Market Update, Friday October 10, 2025
Maybe 5 or 10 years from now investors will look back and cry about the 21 trading days in September of 2025 as the top of the AI bubble. I doubt it will be the case that September 2025 marks the top and for now investors who have ignored the widely communicated “AI is just a bubble”, and the S&P500 in “overvalued” for the last 18-24 months are singing happily after the 21 trading days of September completed a strong 3q. I hope you are smiling as you review your 3q25 brokerage and 401k statements if you had a heavy allocation to stock both international, the S&P 500 and domestic large cap growth stocks. As of October 3rd, here is the ranked sector performance on a 3-month trailing basis as calculated by Fidelity. Investors, this was a near historic 3q for stocks, particularly the combined returns of August and September which historically amount to nothing “net” over the 2 months with Augusts up return being most often erased by a down September. Here is a chart from Carson showing 3rd quarter returns since 1970. As September is historically the worst month of the year for stocks. How off footed were those that traded only on negative seasonals for September? It was the best September in 15 years and second best going back 27 years. Another great chart from Carson showing a September to remember returns the last 55 years. The S&P 500 gained about +3.5%. The Nasdaq 100 gained about 5.25% and the SMH Semiconductor index gained about 12.5% on the month. On the month. Not the quarter or year. The month. Here are those three charts for September. The amazing thing, not a single day closed up or down more than 1%, making it a historically calm month of almost no volatility. After such a strong rally, many investors may wonder if the good returns for 2025 are done. Should they tap out and call it a year? Historically, the answer is no. For ammunition on why high can…

Terms of Endear and Endangerment: Stock Market Update, Friday October 3, 2025
With the markets sitting in late September and early October, a time period I call the quarterly “dead zone” for corporate news, and stock buyback blackouts, and at the fiscal year end for many institutional investors, I’m stepping away from my normal data driven videos. But remember investors, historically, the 4q/“Xmas”/Santa Claus rally begins right around the corner in the 2nd week of October, not in Mid-December. And I believe, you are likely to hear talk of the year end “chase for performance” over the next few months. In order to elicit emotional responses and retain your attention, the financial media likes to throw around a lot of terms that are catchy and easy to remember. Just last week the AI “Bubble” talk began ramping as a “theme” and a talking point largely presented by individuals and strategists who largely have been negative and missed a large part of the rally the last few quarters and 2 years. But hey, everyone knows that term is scary so its memorable even if these individuals have been more wrong than most for years. It got me thinking are there other catchy terms if a retail investor hears on TV from so-called experts, that they should run to or away from? The big one that comes to mind to me is the term “uninvestable. The term uninvestable as a sector or asset class has been thrown around on many occasions over the last 10 years by people in the financial media. But if you were an investor, were you better running to that group or away from whenever you heard it? Thinking back, the first time I heard that term uninvestable loudly on TV was early on in President Obama’s first term. I recall back then many calling the healthcare sector and more specifically the HMO and health insurance group as “uninvestable” as Obamacare was discussed as the socialization of healthcare and a government takeover. Well what happened under President Obama to the HMOs stocks performance wise? They were one if not…

V-Bottom Recovery: Month 6 – What to Buy. Stock Market Update, Friday Sept 26, 2025
If you waited on the Fed, you missed out on about 14% YTD gain in the S&P500 and almost 30% gain off the V-bottom low on April 8th. The Oak Harvest team has discussed for months our belief that we are in V-bottom recovery and in general “no would get in” at prices they really wanted. We messaged that a retest of those April lows was unlikely to come, and investors time was better used studying the history of V-bottom recoveries and their paths. The question now is “where do we go from here” and what should an investor buy if the V-bottom path continues to play out as we expect. First, here’s my trusty overlay of the SP500 during the Dotcom/Internet buildout in 1997-2000 versus our current AI buildout which started in 2h2023. As frequent followers note, it’s been my belief the October 1998 LTCM event driven selloff of -21% on the S&P 500 lined up almost exactly with our recent April 8th, 2025, event drive Tariff tantrum. Yes, the Liberation Day triggered selloff amounted to almost the identical -21% high to low. After such a strong rally, many investors wonder what they should buy if they are still positive on stocks. Do you buy the leaders YTD and the ones leading since the April lows, or should you hunt amongst the laggards YTD? History would say that’s its best to stay with the “winning” sectors, groups, and single stocks however we are near that time of year where “bottom fishing” in lagging single stocks, in the right sectors should be on the radar. Historically, you want to stick with high, or rising relative strength sectors and groups, and those just breaking relative strength downtrends, but you can start to look beyond the top few names in these groups. Why? Because big institutional selling in lagging names is at or near its peak. Unlike most individuals, who are on a calendar year tax closure, many institutional shareholders have fiscal tax years ending September or October. Why is it so…
V-Bottom Recovery: The Beat Goes On, What’s Next? Stock Market Update, Friday Sept 19, 2025
If the Fed Funds Futures market proves its generally worthless predictive self, that is being correct no more than 5-7 days in front of the Fed meetings, the Federal Reserve just cut rates for the first time in almost 3 quarters of a year a few days ago. The first time since December 18th of last year. And if you are an investor waiting on the Fed, you missed out on over 13% total gain in the SP500 since then, the same YTD at 13%, and an impressive almost 29% gain off the V-bottom low on April 8th. Our team has discussed since mid to late April our belief that it was a V-bottom recovery and in general “no would get in” at prices they really wanted. That the retest of those April lows wasn’t coming and investors time was best used to study the history of V-bottom recoveries and their paths, over listening to the usual suspects and doomers predicting crashes based on intellectually stimulating but almost always irrelevant theories or “bubbles”. The question now is “where do we go from here” if the V-bottom path continues to play out as I expect and what should an investor do about it. First, here’s my trusty overlay of the SP500 during the Dotcom/Internet buildout in 1997-2000 versus our current AI buildout which started in 2h2023. As frequent followers note, it’s my belief the October 1998 LTCM event driven selloff of -21% on the S&P 500 lines up almost exactly with our recent April 2025, event drive Tariff tantrum, Liberation Day selloff of almost the identical -21%. Here’s the same overlay of the highly cyclical growth industry that has been critical to driving both cycles, the Semiconductor Sox index. And finally, an even more cyclical subindustry with semiconductors, the semiconductor equipment index which is companies like ASML lithography, Lam Research and KLA Instruments. This is really the cyclical of cyclical growth industries. In fact history says, that the growth cycle in semis doesn’t end until this group outperforms for 12-18 months…