

V-ictory Formation: “The” Bottom looks behind us, Here’s What We Think is Next for Stocks
Another short data driven video investors. For weeks starting about a week after the April 7th bottom in stocks, our videos all highlighted the same opinion and thought. Our team messaged that we thought this would be “The low” for market and stocks would subsequently move sharply higher. No lower low in the S&P500, no retest the lows, no making a new low, like so many retired billionaire alarmist hedge fund managers were voicing at the time and the weeks after April 7th.. and very time to recover back above the 200 day and back to where the markets first broke its 50-day MVA in late February through the first week in March. We hypothesized that the second leg of the move down to -20% was an event induced bear market correction, not a recessionary economic induced selloff that last for quarter and years sometimes. Ex the GFC in 2007-08 and the popping of the speculative Dot.com bubble frenzy in 2000-01, which did proceed longer and deep recessions. History said enough damage had been done and we would form a V-bottomed in a near exact similar fashion as the V-bottoms the last 20 to 30 years. And so it now appears, after nearly 1000 points up in 2 months, others are finally seeing what we did. A v-bottom in stocks. Let’s call it the Victory formation and take a knee given our comeback prediction being met. Looking in the rear-view mirror, the explanations will be, initial dovish tariff talk, then better than expected 1q EPS reports in April, a May 9th China tariff “deal”, and then stable to better economic data in April and March. Only the rumors of lighter tariffs came BEFORE the April 24th Zweig Breadth thrust creating the first of what many chartists call a bullish “Island Reversal” pattern. And investors, the good news here? This V- looks to have happened WITHOUT Federal Reserve intervention and interest rate cutting. So after regaining 6000 almost to the day the market would be expected to in a V-bottom, Friday…
Pres. Trump vs. Fed Chair Jerome Powell: Who’s Right About Interest Rates in 2025?
My title this week, Interest Rate Smackdown: President Donald Trump vs. Federal Reserve Chairman Jerome Powell, whose right on interest rates? Shows my age, I’m the lost generation Gen X, who grew up with both Ronald Reagan as President and the rapid emergence of the WWF, World wrestling Federation as entertainment with Hulk Hogan, Andre the Giant, Randy Savage, and the “nature boy” Ric Flare, “wheew” rocking to prominence. For those not familiar with wrestling and bigger boxing fans, I probably should have titled this one “Let’s get ready to rumble”, the famous opening used by ring announcer Michael Buffer who also was the exclusive ring announcer for President Trump owned casinos when they hosted boxing matches. This week, we aren’t talking directly about stocks and the stock markets. Nope, we are going to focus on the bond market and more importantly the direction of interest rates that the Federal reserve, ex programs like QE, has control over, those are shorter term interest rates. While many investors ask what interest rates are doing and directly go to what the Fed’s actions are, more seasoned investors know that the markets and investors control the level of most interest rates. The Federal Reserve sets the federal funds rate. What this rate? It’s the interest rate depository institutions, mostly banks, lend reserve balances to other institutions overnight on an uncollateralized basis. Basically, it’s the rate banks charge each other for short-term loans. Time and time again on TV we here many commentators talk about “Fed Funds futures”, which is the markets guestimate about what direction, when, and by how much the Fed will change this rate in the future. As we’ve discussed for years at OHFG, historical data says, tracking, discussing and worrying of FFF is meaningless and unpredictive of future Fed action outside of the 5-7 day window in front of each Fed meeting. In other words, the Fed historically has almost no real idea where they will be setting interest rates out months, or quarters in the future, let alone years,…

Stock Market V-Bottom: History Is Repeating and Most Investors May Still Be on the Sidelines
This is going to be another short video. More thoughts on V-bottoms in stocks which our team has discussed for weeks post the early April, Washington DC induced, Tariff tantrum, hedge fund delivering and blowup and subsequent rally that has mystified many bears and left many traders in the dust. We’ve discussed for weeks in our videos, looking back April 7th “was what we thought was “The Low” for the overall S&P500 index and USA stocks most likely for the rest of 2025, ex the unforecastable Black swan event. Much to the dismay of those calling for crashes, lower lows, retests of the lows, trading ranges lower, or worse yet those blown out on margin at the lows, or investors who panicked and went to cash late in the move down. Sorry retired baby boomer hedge fund billionaires Ray Dalio and PTJ, I continue to think you are wrong at these turns, much as you have been in the last 10 years. Ex the GFC in 2007-08 and the popping of the speculative Dot.com bubble frenzy in 2000-01, which did proceed longer and deep recessions. History says enough damage had been done and we have V-bottomed in a near exact similar fashion as the V-bottoms the last 20 to 30 years. And investors, the really good news here? This one looks to have happened WITHOUIT Federal Reserve intervention and interest rate cutting. The Zweig Breadth thrust on April 24th, created the first of what many chartists call a bullish “Island Reversal” pattern. The in progress China tariff “deal over the weekend of May 9th, almost exactly 1-month after the April low and 2 months to the day from when the S&P 500 first broke its 200 day MVA on Friday March 7th created a second island reversal higher leaving those longing for lower prices to get back in desperate to buy or cover their shorts. We stalled and faded back from about 5965 for roughly a week back to the 200 day, and as of this writing on Memorial Day….
From Panic to Peak: Why Markets May Hit New Highs This Summer
Last was a short video. Its title, V-bottoms in stocks, no one gets in. We had discussed for weeks in our videos, looking back April 7th “was what our team though was “The Low” for the overall S&P500 index and USA stocks much to thea dismay of those calling for crashes, retests of the lows, trading ranges lower, or worse yet those blown out on margin at the lows, or investors who panicked and went very rare to cash late in the move down. In our prior four videos, we discussed that ex a few periods like the GFC in 2007-08 and the popping of the speculative Dot.com bubble frenzy in 2000-01, history had said enough damage had been done and many hedge funds got zero out on the lows and many retail investors have been buying the correction. The Zweig Breadth thrust on April 24th, created the first big technical indicator we needed to be much more confident for our prior call for a bullish move higher. And the tariff “deal with China 3 weeks later over the weekend created the reason most needed to finally cover shorts or desperately try to get back in the markets gapping over the 200-day MVA like it was nothing. Here’s another interesting breadth thrust indicator that was recently triggered that I’ve never heard of before but looks like interesting data. It’s based on the % of stocks hitting new 20 day highs. I believe the DeGraaf, is the Jeff DeGraaf from RenMac who appears on CNBC pretty often. When you combine the 2 breadth indicators, they have only hit together within 1 month 8 times in history. Here’s the results from the 7 prior periods whose outcomes we know. A +16% gain would be S&P500 over 6800 by XMASish and a +26% gain would be an S&P500 over 7400 out a year. History was already on the side of the bulls, saying calls for a retest of the sub 500 lows would be wrong. Investors, like it or not, this is what…
V-Bottoms: No One Get’s In, Bears left Behind
This is going to be a short video. Its title, V-bottoms in stocks, no one gets in. I am confessing that I waited until Monday afternoon to write this one as I wanted to see if there was a weekend China trade deal, and if President Trumps 3rd call over the last 4 weeks to buy stocks would prove as good as the first two. Of course we now know, over the weekend there was a big reduction in tariffs to and from China and what looks like a big walk back of verbal hostilities between the two countries. And on Monday, stocks exploded higher led by higher growth technology stocks and semiconductors up 4.35% to almost 10% in many semi equipment company names. The S&P 500 gained over +3.25% and the laggard was the slower growth more value biased Dow Jones 30. As we had postulated for weeks in our videos, looking back April 7th “was “The Low” for the overall S&P500 index and USA stocks much to the dismay of those calling for crashes, retests of the lows, trading ranges lower, or worse yet those blown out on margin at the lows, or investors who panicked and went to cash late in the move down. As we discussed for our prior three videos, ex a few periods like the GFC in 2007-08 and the popping of the speculative Dot.com bubble frenzy in 2000-01, which did proceed longer and deep recessions. History says enough damage had been done and many hedge funds got zero out on the lows and many retail investors have been buying the correction. The Zweig Breadth thrust on April 24th, created the first of what many chartists call a bullish “Island Reversal” pattern. And the tariff “deal over the weekend created a second island reversal higher leaving those longing for lower prices to get back in desperate to buy or cover their shorts. On Monday the 12th, we blew right back through the 200-day MVA which many had predicted would stop us. History, being on…
Stocks Rebound: Have We Seen the Market Bottom?
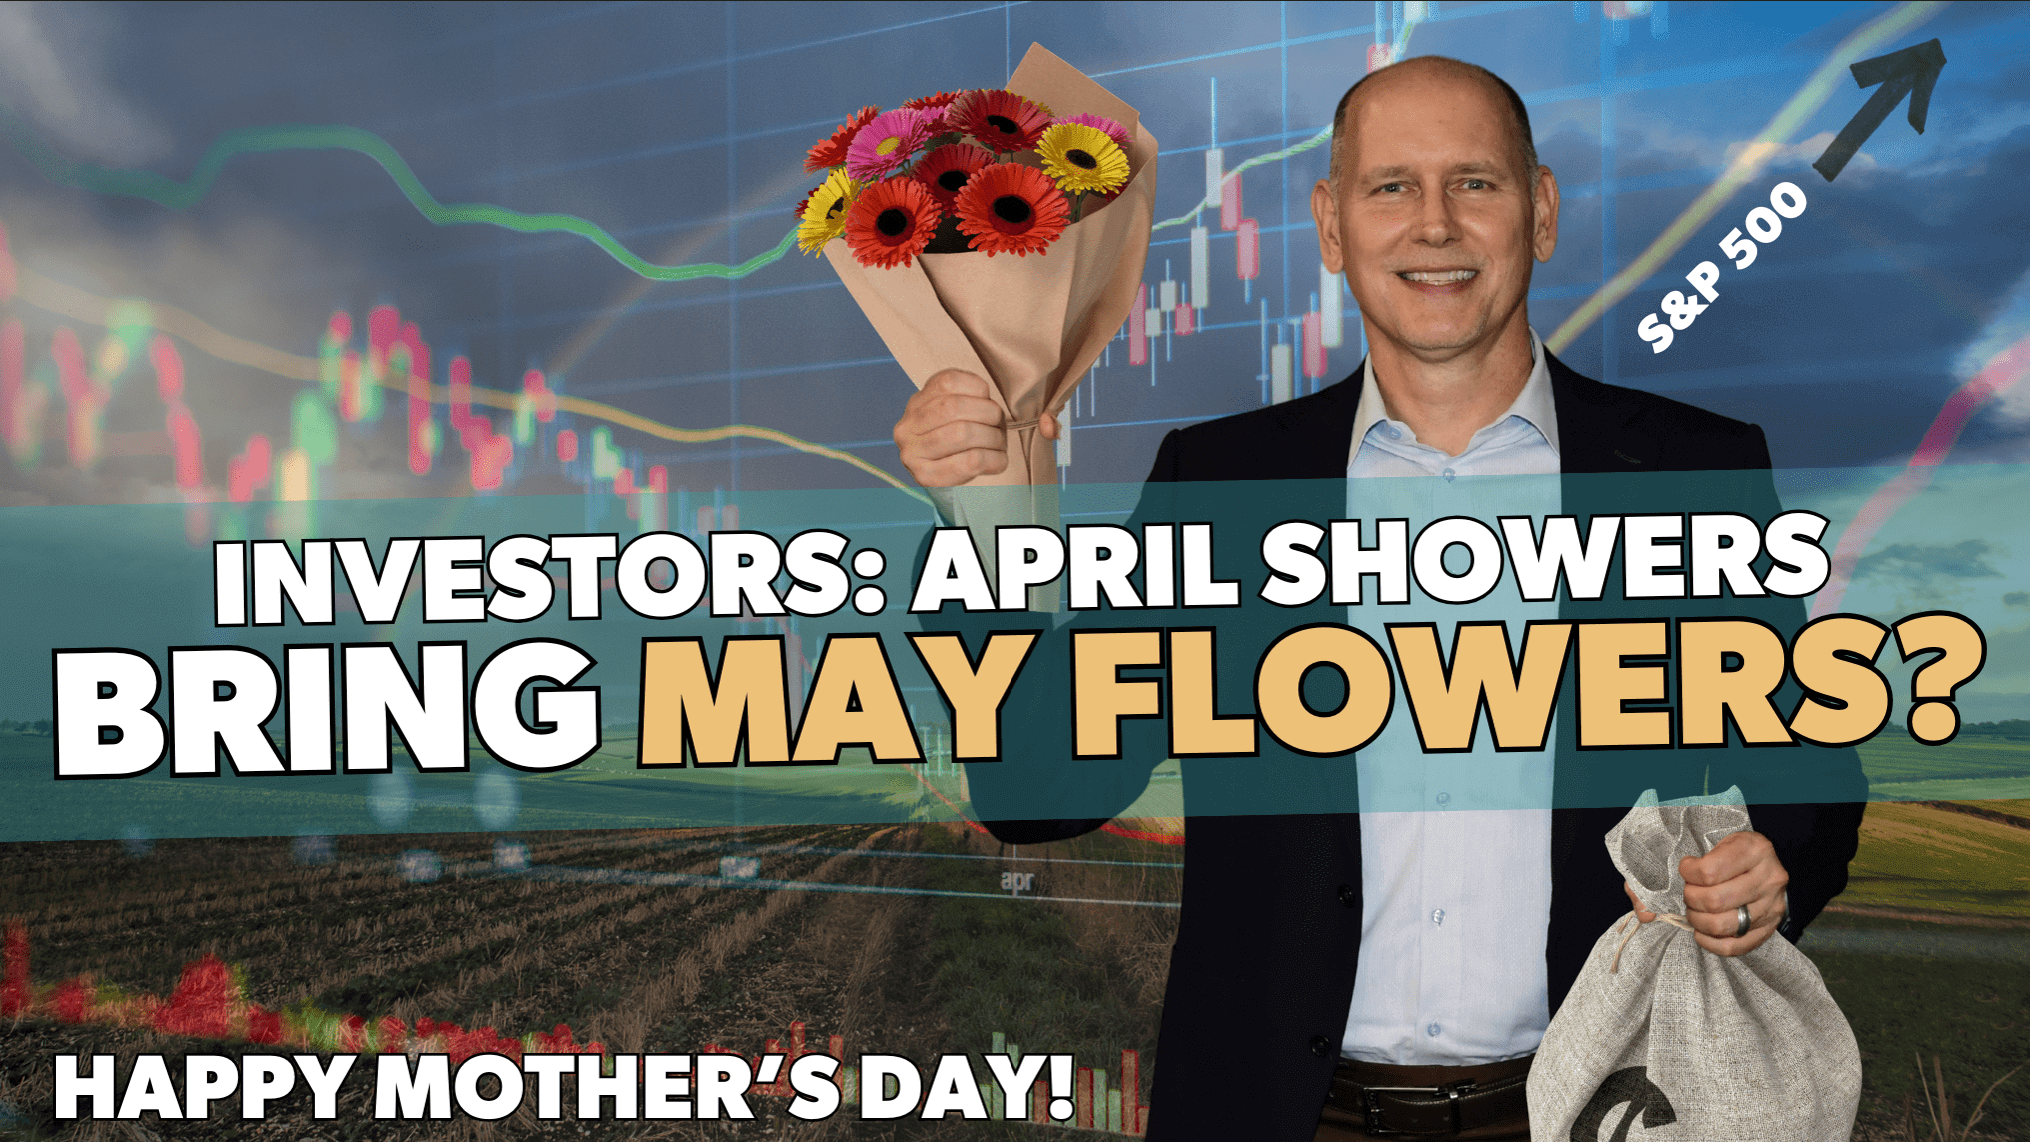
This is going to be a short video as hopefully we are ending a relatively uneventful and lower volatility week. When I wrote this script, the market had rallied back in a rare 9 straight day rally. April proved to be one of those months that short term traders probably love and long-term investors watching their portfolios too often hate. So far, early April stock showers have brought May flowers. The SP500 ended the month of April down a very modest -.75% while the Tech heavy NASDAQ ended the month up +.85%. Of course, this doesn’t tell the whole story of April as intra month, the SP500 fell – 14.5% from its peak to its intraday low on April 7th and the NASDAQ fell, also fell -14.55%%. Since happier days at the end of February, the S&P500 fell – 18.8% from Feb 28th into the April 7th low and the Nasdaq fell a astounding -21.55% over the same time period. As of this writing the S&P500 and the NASDAQ are both about -4.6% lower over those 2 months. Right now it looks as if, April 7th “was “The Low” for the overall S&P500 index and USA stocks. Ex a few periods like the GFC in 2007-08 and the popping of the speculative Dot.com bubble frenzy in 2000-01, which did proceed longer and deep recessions, history says enough damage had been done and many hedge funds got zero out on the lows and many retail investors have been buying the correction. Just to let one know,in my book, -20% in the market is not a “DIP”, in anyone’s book unless you are a online financial media poster not trading the markets or investing. Here’s a chart of the SP500 since the end of the GFC in 2009 with and approximate channel drawn. Next is the 2 year chart of the S&P 500 with the recent 3 months highlighted, including what looks like the recent “v-bottom”, followed by the Zeigh Breadth thrust confirmed on April 24th, leaving what many chartists call a…

A Stock Market G.O.A.T. Appears: Perfect Historic Track Record
GOAT: That’s “Greatest of All Time” We’ve messaged followers and investors the last 3 weeks, that the data said it wasn’t time to panic if you were a retire or already heavily invest, but rather time step up and to add to positions if you had some extra cash or if you were in your savings faze, earlier in your working careers, years from retirement. The S&P500, after essentially peaking Dec 6th, just under 6100, then meandering for 3 months into March, tanking on the frictionary tariff policies of the current administration, the index looks to had made a low on April 7th. That’s a -21.4% peak to trough intraday move lower, and almost -19% if you are using closing prices. The trillion dollar yet was April 7th “A Low or The Low for the overall S&P500 index and USA stocks. For 2 weeks our team messaged, that Ex a few periods like the GFC in 2007-08 and the popping of the speculative Dot.com bubble frenzy in 2000-01, which did proceed longer and deep recessions, history says enough damage had been done and one should be adding to desired positions. Here’s the log chart of the SP500 since the end of the GFC in 2009 we shared for two weeks. We went fom the top of the channel at around 6100+ in early December, to the bottom of the channel the last 5 months as initial hopes by investors for growth-oriented policies in DC were dashed instead for changing tariffs, DOGE cutbacks and other frictionary policies. Historically, if we aren’t entering a prolonged recessionary period, this graphic would say buy stocks, add to positions. Yes, against the normal doomer calls, most recently due to the uninspiring historically unpredictive, dreaded Death Cross which we discussed last week. You can catch our thoughts on the “death cross” in last week’s episode entitled “Market Correction or Bear Market, A Low or The Low” And then on April 24th one of the financial GOATs in the market appeared. One of the Greatest of All-time…
Market Correction or Bear Market? This Could Change How You See Aprils Drop
First off, I apologize that last week’s video was so long. I’ll keep this one short, I mean why bother make it a long video, with as much news and changes from the White House every few hours or days, by the time I write this, its reviewed by compliance, filmed by Erik, edited, and posted it takes about 5 days and the world could change again! The SP500, after essentially peaking Dec 6th, my bday, at just under 6100, then meandering between 6125 and 5825 for 3 months into March, tanking on the frictionary tariff policies of the current administration, the index looks to had made a low on April 7th. That’s a -21.4% peak to trough intraday move lower, and almost -19% if you are using closing prices. Technically, based on conventional market definitions, this is a “correction”, but most watching their portfolios, heavily concentrated in technology and consumer discretionary stocks know that many of their holdings and maybe their overall portfolios are in a bear markets defined by > 20% losses. The trillion dollar, yet currently unanswerable question is was April 7th “A Low or The Low for the overall S&P500 index and USA stocks. Ex a few periods like the GFC in 2007-08 and the popping of the speculative Dot.com bubble frenzy in 2000-01, which did proceed longer and deep recessions, history says enough damage has been done and one should be adding to desired positions over the coming weeks and months. Here’s a log chart of the SP500 since the end of the GFC in 2009. We’ve been below the channel for a few months during the Covid lockdown and its recession. And we’ve been above the ascending channel for a few months during the euphoria of post Covid reopening. More recently, we’ve gone from the top of the channel at around 6100+ post 2024 Presidential election when the vast majority of investors, including ourselves were promised carrot approach, pro-growth policies and deregulation and we’ve now gone to the bottom of the channel the last…
Sometimes: You Gotta Close Your Eyes and Buy (or Laugh)
First off, neither the financial markets nor anyone we know had anything close to this in their 2025 Trump 2.0 playbook and his economic plan. While the economy was slowing all 2h24, the markets thought Trump 2.0 would lead off with some pro-growth and pro-deregulation in November 2024 post-election. Those thoughts quickly morphed into the 2h February though last week bear market selloff and the thoughts of a potential growth collapse. The markets had corrected -10%, on 1st year Presidential cycle, 1h move down on economic slowing. This slowing had been ongoing since last July but had slowed more post Xmas in the new year. The markets were pricing in about 10% across the board global tariffs into liberation day. The Navarro plan that was presented was nothing like anything anyone had ever seen and appeared like it was drawn up on the back of a napkin a few hours before the President’s speech. The bad news is that the tariff announcements were far worse than expected, causing a sharp drop in the market. The Trump calculation substituted goods trade deficits for tariffs. Here’s a link to our last week’s video on the topic. https://www.youtube.com/watch?v=d9PYRR-wI_c Frequent followers know that I am a student of market history. While I am still under 60 years old and have experienced a number of major economic cycles and stock market crashes and bull market runs, I haven’t experienced everything. But Those kinds of historical studies helped OHFG clients be guided and almost universally not panic during the Covid market collapse as our team studied the historical pandemic response to the 1918 Spanish flu. We studied the ebbs and flows of the prior virus, what our leaders did to stimulate the economy, and what the financial markets did back then as well. Remember the public financial markets are the summation of the collective behavior of investors, investors are human, and regardless of what generation yo are, Boomer, Gen-x like myself, Gen Z, millennials or others, humans tend to have similar behavioral and emotional responses time…
“Tariff”ied Air and a Trumpster Fire
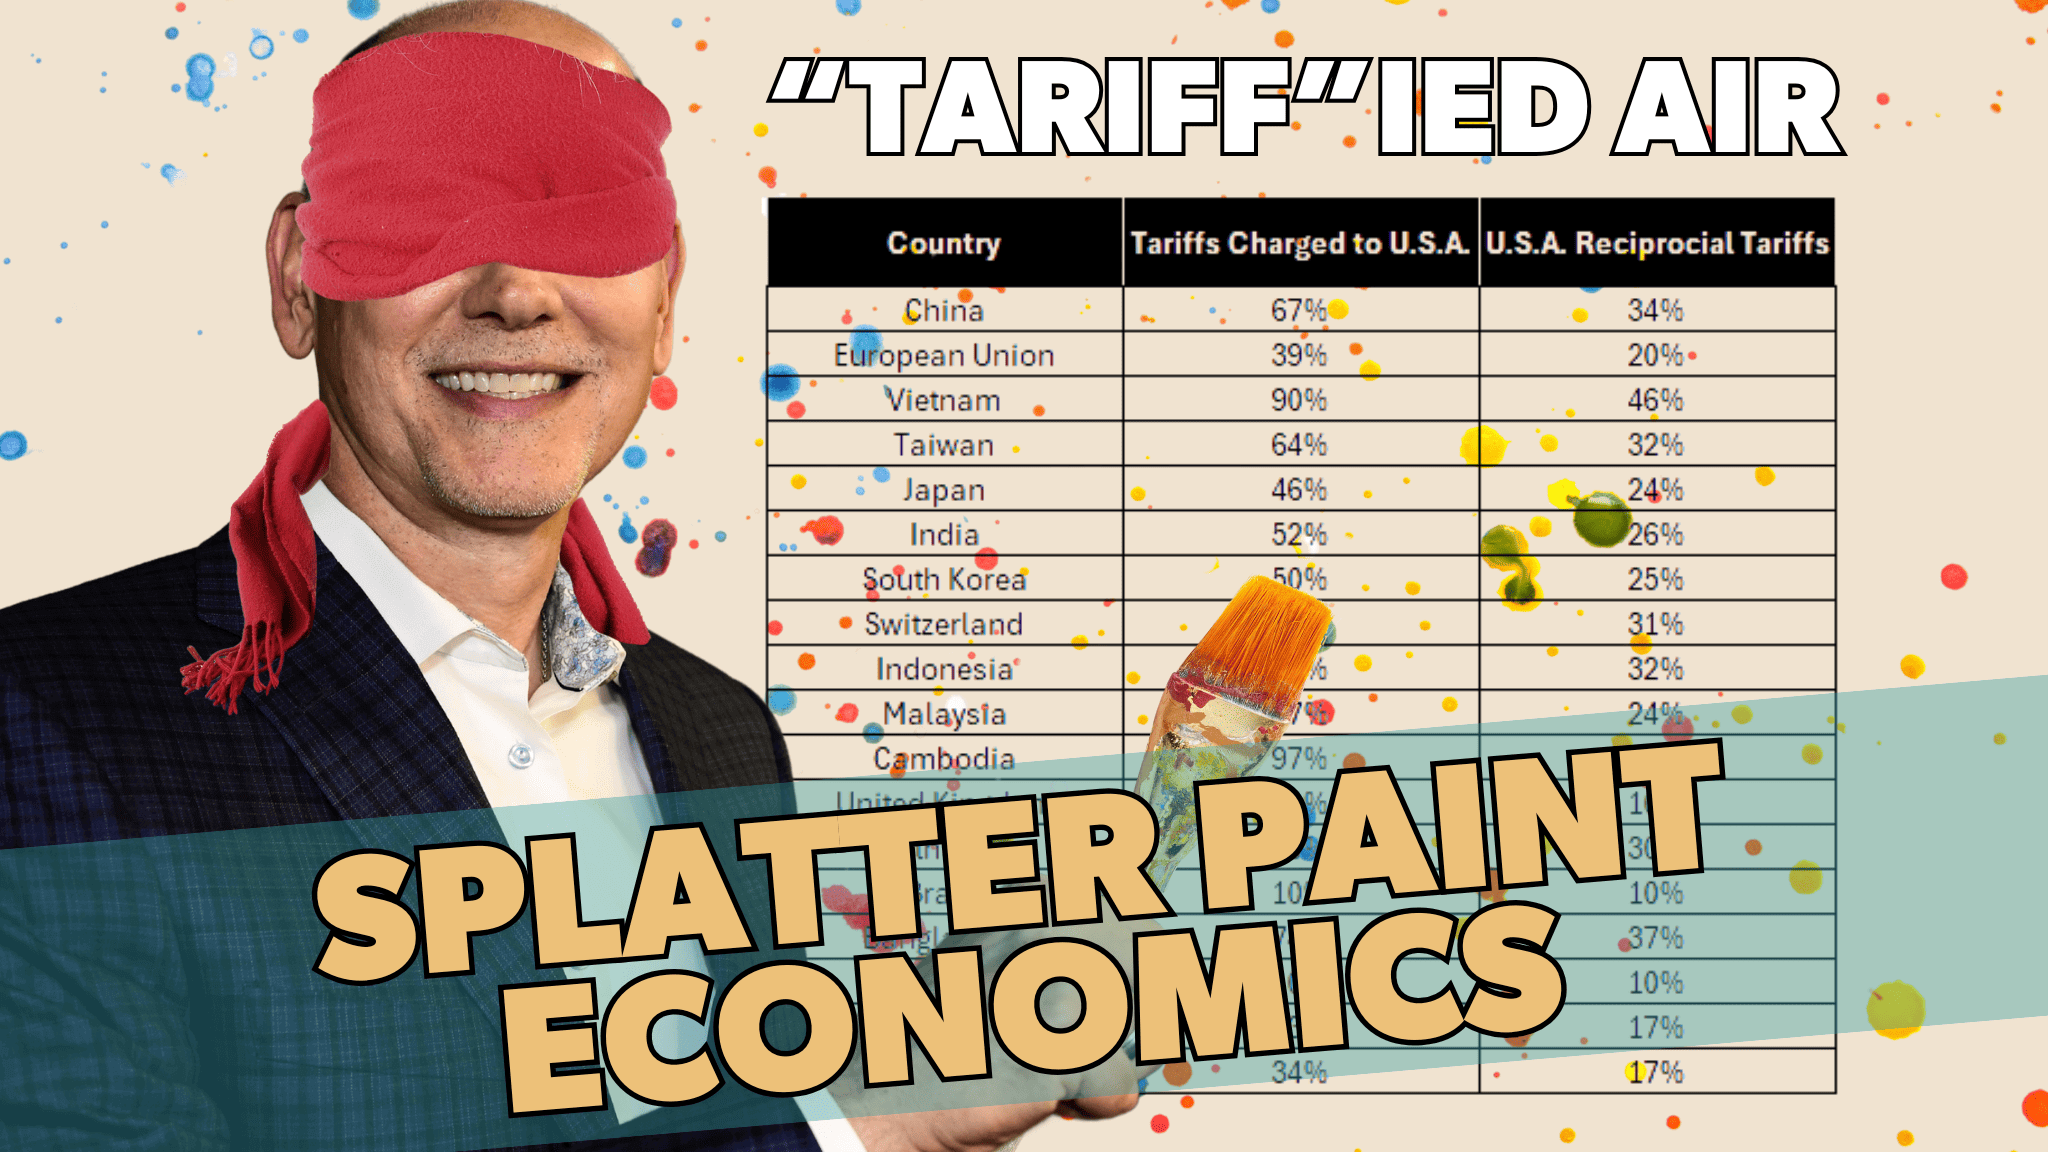
First off, neither the financial markets nor anyone we know had anything close to this in their 2025 Trump 2.0 playbook and his economic plan. Yes, the markets were expecting higher uncertainty from the US reciprocal tariffs. The market was pricing in about 10% across the board global tariffs into last Wednesday so called “liberation day”. The markets had already corrected a quite normal -10% move down on economic slowing that had been ongoing since last July but had slowed more post Xmas in the new year. But nowhere was any kind of plan like this sniffed out in the markets. Probably because, as a few sources have since reported, the plan itself was still being decided up until 3 hours before the speech. Initially, the market traded up almost 1% during the first few minutes of his speech as it looked like the 10% tariff level was the news and priced into the financial markets. However, the President kept talking and revealed his data table for all to see. It didn’t take long for the markets to see that Trump’s tariffs were not true tariffs and how they were calculated were not based on any known practice. The bad news is that the tariff announcements were far worse than expected, causing a sharp drop in the market. The Trump calculation substituted goods trade deficits for tariffs. It ignored trade in services completely. The formula the Trump team came up with is about trade imbalances with the U.S. rather than reciprocal tariffs. While the administration hopes tariffs on goods exported to other countries will raise hundreds of billions in revenue annually for the U.S., reducing domestic exports will slow both domestic and global economic growth. Remember, US domestic economic growth was already slowing in the 2h24 in to the November Presidential election as the Biden IRA spending bonanza had peaked in July 2024 along with excess government hiring. It was already slowing more post XMAS as consumer uncertainty over DOGE government fiscal cutbacks and immigration exportation had risen. Now throw…