


Keep Your Eyes on The Prize: Stock Talk Update, Friday May 1, 2026
Today, we want to bring you back to what drives stock prices over time… EARNINGS. Not headlines. Not geopolitics. Not Oil, not even the Federal Reserve. EARNINGS. All of the reference data here is available for free on FactSet’s website. They have been one of the best sources for decades of earnings data. Stock Prices follow earnings over time and right now earnings are not only rising, but they are also accelerating. Right now, corporate America is still delivering for shareholders. Let’s see where and how. EARNINGS SCORECARD – STRONG AND GETTING STRONGER This video was filmed right before mid-weeks S&P500 earnings tsunami and at that point for Q1 2026, with 28% of S&P 500 companies reporting, 84% of S&P 500 reported a positive EPS surprise and 81% of S&P 500 companies reported a positive revenue upside. Once again, those are big numbers. 84% of companies beating earnings and 81% beating revenue Earnings surprises averaged +12.3% and S&P 500 EPS growth +15.1% which is its 6th straight double-digit quarter Bottom line: This is a strong revenue and earnings economic cycle even if the reported government GDP numbers don’t look huge. PROFIT MARGINS are at RECORD LEVELS, which is a good thing for shareholders. Net margins 13.4% – highest in 15+ years Technology margins are near 29% even with the huge and accelerating AI spending. Margins are trending up still. Bottom line: Companies are becoming more efficient. Doing more with less. We might not like this as someone looking for a new job out of college, or worse yet someone just laid off from a Tech job, but as a shareholder, we love this trend. SECTOR LEADERSHIP, where’s the strength? Leaders: Technology +46%, Materials +33%, Financials ~20%, Industrials mid-teens Laggards: Energy -14%, Health Care -9% This is still an AI + industrial capex cycle underneath the surface. Bottom line: Sector Leadership is strong, generally concentrated in growth and cyclical areas of the economy. The negative sign in the energy sector might surprise many, but it is most likely because most…

It’s an AI Bubble! (So Why Are Many Investors Cautious?) Stock Talk Update, Friday April 24, 2026
“It’s an AI bubble.” If you have been watching many financial media outlets for the last few years, You’ve been hearing that declaration, an opinion, often stated as fact. The investment team at OHFG has been asked this question for well over 18 months now. Are we reliving the Dotcom Capex boom, internet and mobile phone buildout of 1997-2000, in the AI investment cycle that started late 2023 with the release of Chat GPT or is this something new and different? But here’s the question I’ve asked for over a year, If it’s such an obvious bubble, and so many pro’s are good at spotting bubbles in advance, why are so many public market equity professional investors still cautious? I mean why aren’t they all-in like 1999? That disconnect is where the real story is. We compare the dot-com the stall in the summer of 1999 then surge into 2000 and today’s AI acceleration into 2026. Think of both as the 7th inning stretch, business momentum was strong, but the stock markets paused for 4-6 months before reaccelerating up. CAPEX COMPARISON In 1999, companies were racing to build the internet. Back then it was fiber networks, telecom infrastructure, and eventually the mobile internet. Massive capacity was being built, but it was ahead of real demand. Ahead of Amazon, ahead of Netflix and streaming services, and ahead of most mobile telephone applications we use today. That summer—mid-1999—was the 7th inning stretch. The real excess in public equity markets came after that. It came in the 6 months during the 4th qtr 1999 into late March in 1q2000 as spending plowed ahead of end demand. In many ways, today looks eerily similar to that period in late 1999—but it’s fundamentally different. We are three+ years into AI spending. Three years from the launch of ChatGPT being Nov 30, 2022 and usage is exploding from an already high level and growth rate. It is acceleration—driven by real, existing usage and demand for compute. For systems driven by NVDA and others semiconductor chips. Today,…

“This Time It’s Different… Or Not?” Stock Talk Update, Friday April 17, 2026
Investors, If you’ve watched markets over the years, you’ve heard this phrase again and again: “This time is different.” Today, the headlines might feel heavier than the past—war, oil spikes, political uncertainty, and AI disruption. It may feel different. That said, investing on one’s feelings and emotions is usually a recipe for bad outcomes. But investors is it actually different… or does it just feel that way? Are you possibly letting your emotions drive your decisions? Let’s walk through the data. Section 1: Core Message Markets price uncertainty quickly, albeit not perfectly—but efficiently over time War headlines feel extreme, but markets most often adjust faster than expected Short-term volatility is normal; long-term returns follow earnings, innovation, and interest rates. Every stock market correction has a new reason—but the pattern more often than not repeats Section 2: War and Markets What History Actually Shows Let’s go back and look at major conflicts, wars, and how stocks performed in the first year. World War II (1942) Market initially declined sharply in early 1942 But once the USA’s direction became clearer, stocks bottomed and rallied strongly Full-year return in 1942: positive to the tune of 19.75% to almost 36.5%, each and every year the US was active in WW2, 1942-45. Korean War (1950) Surprise invasion triggered volatility Market recovered quickly as economic activity accelerated Full-year return: 30.81% Vietnam War Escalation (1965) Gradual buildup, not a onetime shock event However, Strong economic backdrop supported equities Full-year return: 12.4% Iraq War (2003) Markets declined leading into the war Once conflict began, uncertainty dropped, it didn’t rise and stocks rallied sharply Full-year return: ~+28.36% Investors, historically, more often than not, markets bottom near the start of conflict or soon after the fighting starts and then begin to recover on peak uncertainty, as uncertainty declines even if the fighting continues. Section 3: Why Today Feels Different Today’s concerns include geopolitical conflict, oil volatility, AI disruption, and higher interest rates. It also feels different because now, advances in technology have given us up to date information at our…

The “HALO” Trade vs. AI Infrastructure: Why a Barbell Portfolio Makes Sense
What if the best opportunities in today’s stock market sit at two extremes? On one side: Older economy, asset-heavy, durable businesses. On the other side: Cutting-edge AI infrastructure driving the next cycle. Today, I’ll break down what our Oak Harvest Team has been thinking: We’ve talked about the AI trade for over a year, but what about the “newer” themed trade that’s being talked about – The HALO trade, HALO stands for Heavy Assets, Low Obsolescence. How does this theme compare to AI infrastructure, And why a barbell strategy for a portfolio may be the most rational positioning right now. What is the HALO Trade? HALO stands for Heavy Assets, Low Obsolescence. What does this mean? Wall Street is famous for catchy anacronyms. MAG5, MAG7, REITs, things that are short and grab your attention. Think of businesses where: The assets are hard to replicate, The useful life of those assets is long, And disruption risk is generally low. These businesses tend to have Four characteristics: 1. Capital-intensive, real assets: Think of Pipelines, railroads, energy infrastructure. 2. Long-duration cash flow assets: These are often contracted or regulated revenue streams like utilizes or toll roads. 3. Low technological disruption risk: Things like Steel, electricity, and transportation networks don’t get replaced overnight. finally, 4. Pricing power tied to inflation: many have rate and pricing structures or commodity linkage that actually benefit from higher trending inflation. Examples of HALO sectors include Midstream energy, utilities, industrials, materials, infrastructure, mining. Why investors are revisiting HALO now: Interest rates are structurally higher and look to be higher for longer, as Inflation remains somewhat sticky, so the Durability of earnings matters as much if not maybe more than growth promises. AI Infrastructure Trade Now let go back and contrast that with the AI infrastructure buildout that Charles and I have discussed for about a year. This trade is defined by: Massive capital spending, Short innovation cycles, High growth expectations, and generally Winner-take-most dynamics. Key areas here include: Semiconductors, optics providers, Cloud data centers, Power demand, Networking infrastructure. And…
AI vs Dot-Com: Repeating History? Stock Talk Update, Friday April 3, 2026
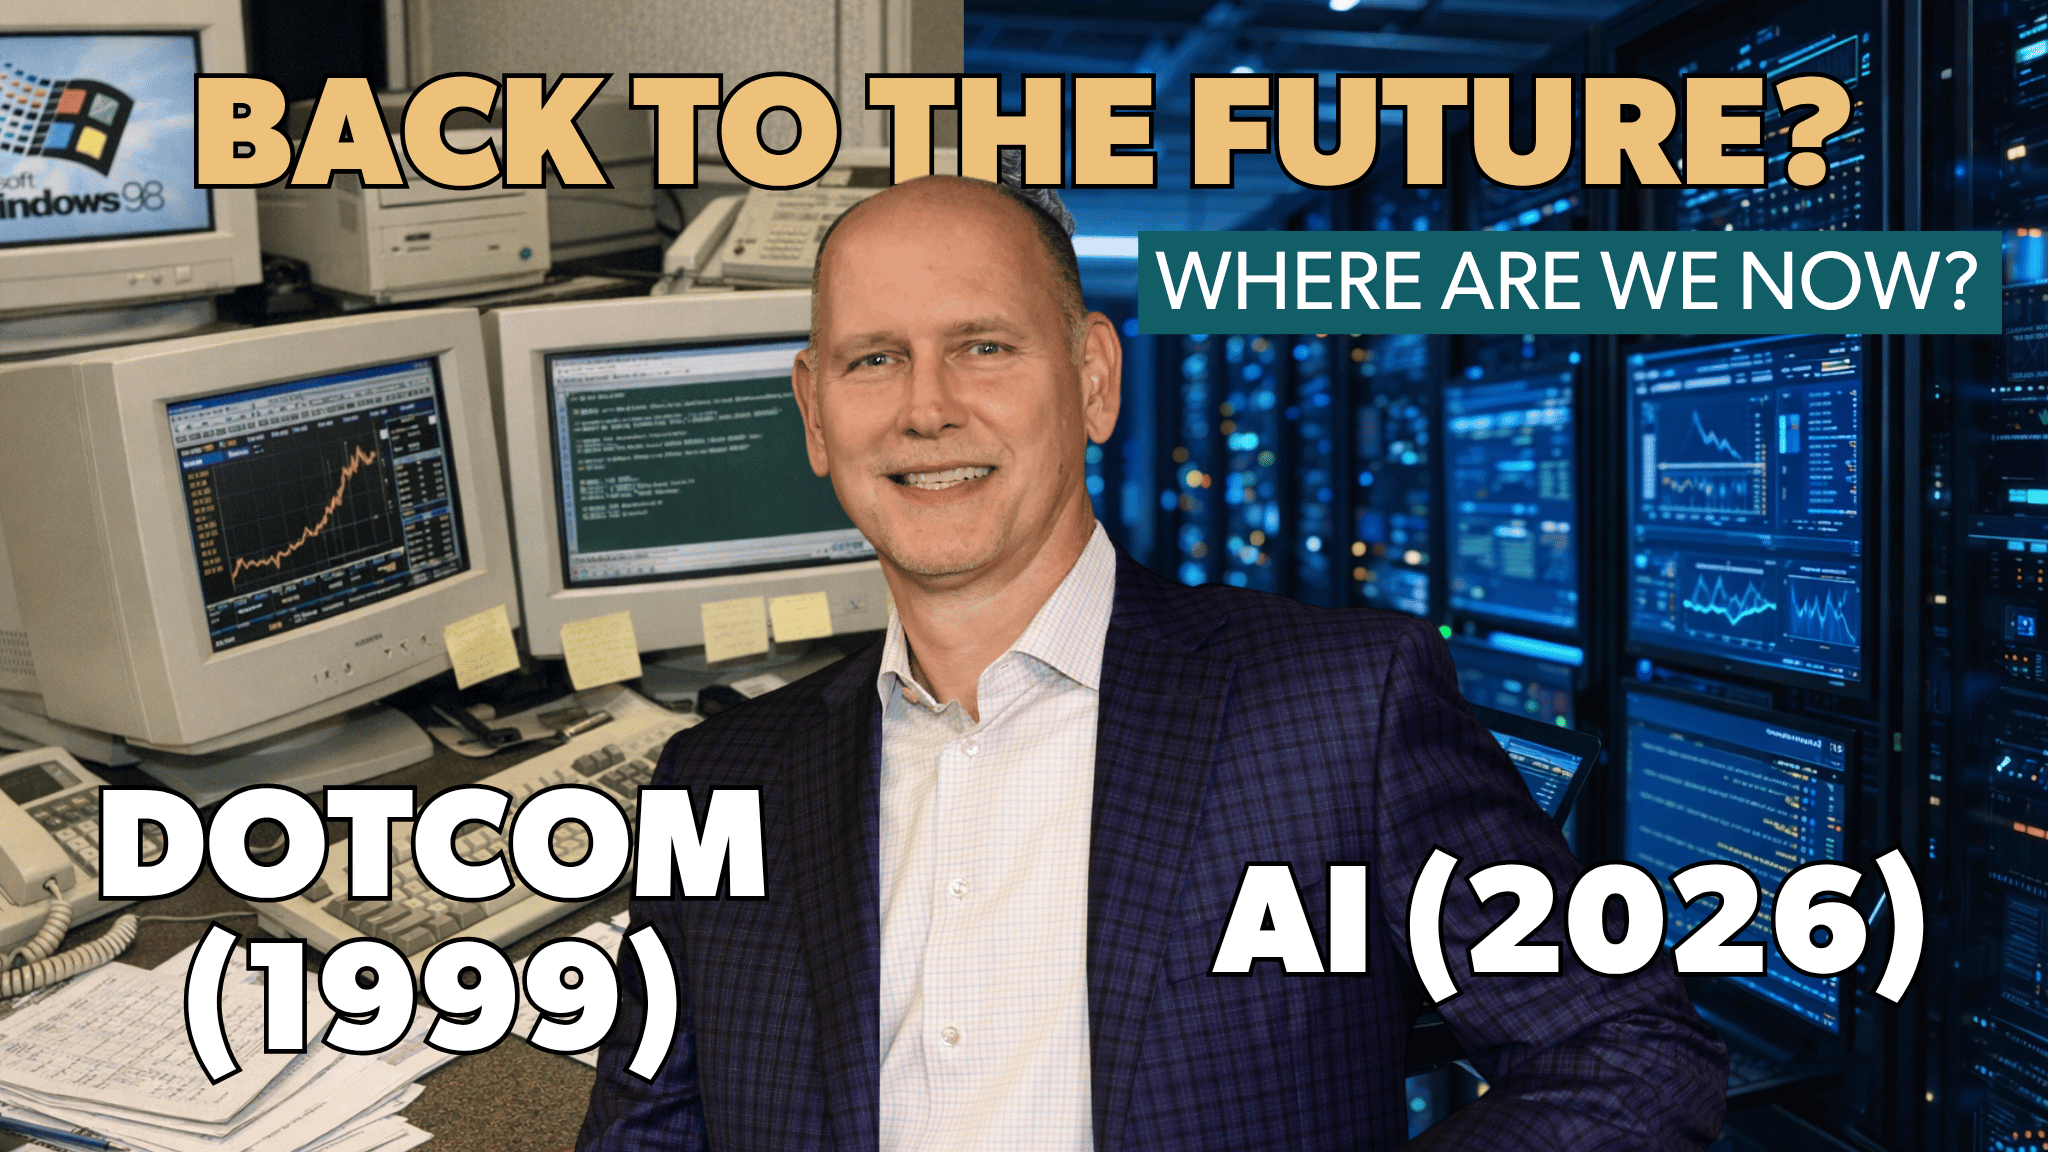
We’ve asked this question for almost a year now. Are we reliving 1998-2000, the Dotcom Capex boom and internet and mobile internet buildout, in the AI investment cycle or is this something new and different? Investors, today’s AI boom continues to feel familiar to me and I had the opportunity to work in San Fran and then manage money with Charles back in Houston during the Dot Com run in stocks. Both cycles look and feel a bit similar with some twists. Both were periods of Rapid capex investment. Some tech and infrastructure stocks soared with big promises about the future. But underneath the surface—this cycle is not exactly the same. And these difference matters for your portfolio and your retirement. THE COMPARISON Today, we’re going to compare one more time, two very specific moments: The stall and re-acceleration phase of the dotcom cycle which was summer of 1999, second and third quarter with the current trailing 2 quarters 4q25 and 1q26 and the and the reacceleration phase of AI today. As far as stocks go, think of both periods as the 7th inning stretch. Not the beginning of the cycle. But it’s likely, not the end either. It’s the point where momentum is strong, many stocks and valuations paused, but some risk was starting to build. CAPEX COMPARISON In 1999, companies were racing to build the internet. Back then it was fiber networks, telecom infrastructure, and eventually the mobile internet. Massive capacity was being built, but it was ahead of real demand. Ahead of Amazon, ahead of Netflix and streaming services, and ahead of most mobile telephone applications we use today. That summer—mid-1999—was the 7th inning stretch. But the real excess in equity markets came after that…into late 1q2000. In many ways, today looks eerily similar to that period—but it’s fundamentally different. AI spending is not early-stage buildout. We are three+ years into it with the launch of ChatGPT being Nov 30, 2022. It is acceleration—driven by real, existing usage and demand for compute. For systems driven by NVDA…
Why Aren’t Stocks Lower? Stock Talk Update, Friday March 27, 2026
Many Investors Are asking Why Aren’t Stocks Down More this year? War in Iran? Geopolitical strife in virtually every region of the world? It’s a fair question. We’ve had geopolitical tension. We’ve had an energy shock tied to the Iran situation. We’ve seen volatility spike to near 30 on the Vix. And yet—the S&P 500 is holding up far better than many investors expected, down about -5% YTD and , -7% off ATH’s. So far a pretty ordinary pullback after the type of run we had from April 3-5th bottom into Halloween last year. So today, I want to walk you through three key reasons why the market has been more resilient than it “feels.” And more importantly—what that means for investors, especially those in or near retirement. Energy Is No Longer as big a Major Consumer Shock Let’s start with energy. Historically, spikes in oil and gasoline prices have been one of the fastest ways to slow down the U.S. economy—and the stock market. But there is a key difference today. Energy costs don’t take up as much of the household budget as it used to. Let’s look at the data. Back in the late 1970s energy products made up over 6% of U.S. household consumption. That was a major burden. When energy prices spiked, consumers had to cut spending elsewhere. And that slowed economic growth quickly. Now compare that to the last decade. For the last decade, energy has averaged closer to 2% of household consumption. That’s a dramatic shift. Let’s take a look at the data, here’s a chart from Barclays. [What this means is that even when energy prices rise today, the impact on overall consumer spending is much smaller than it was in past decades. This matters because: Consumer spending drives close to 70%+ of the U.S. economy And ultimately, that spending is a big driver of corporate earnings So yes, energy prices have moved higher, and quite fast.But the economic shock, so far, is far more muted than it would have been 30 or…
YTD: Inflation (Oil) Up, Stocks Down. Are We Near Max Pain?
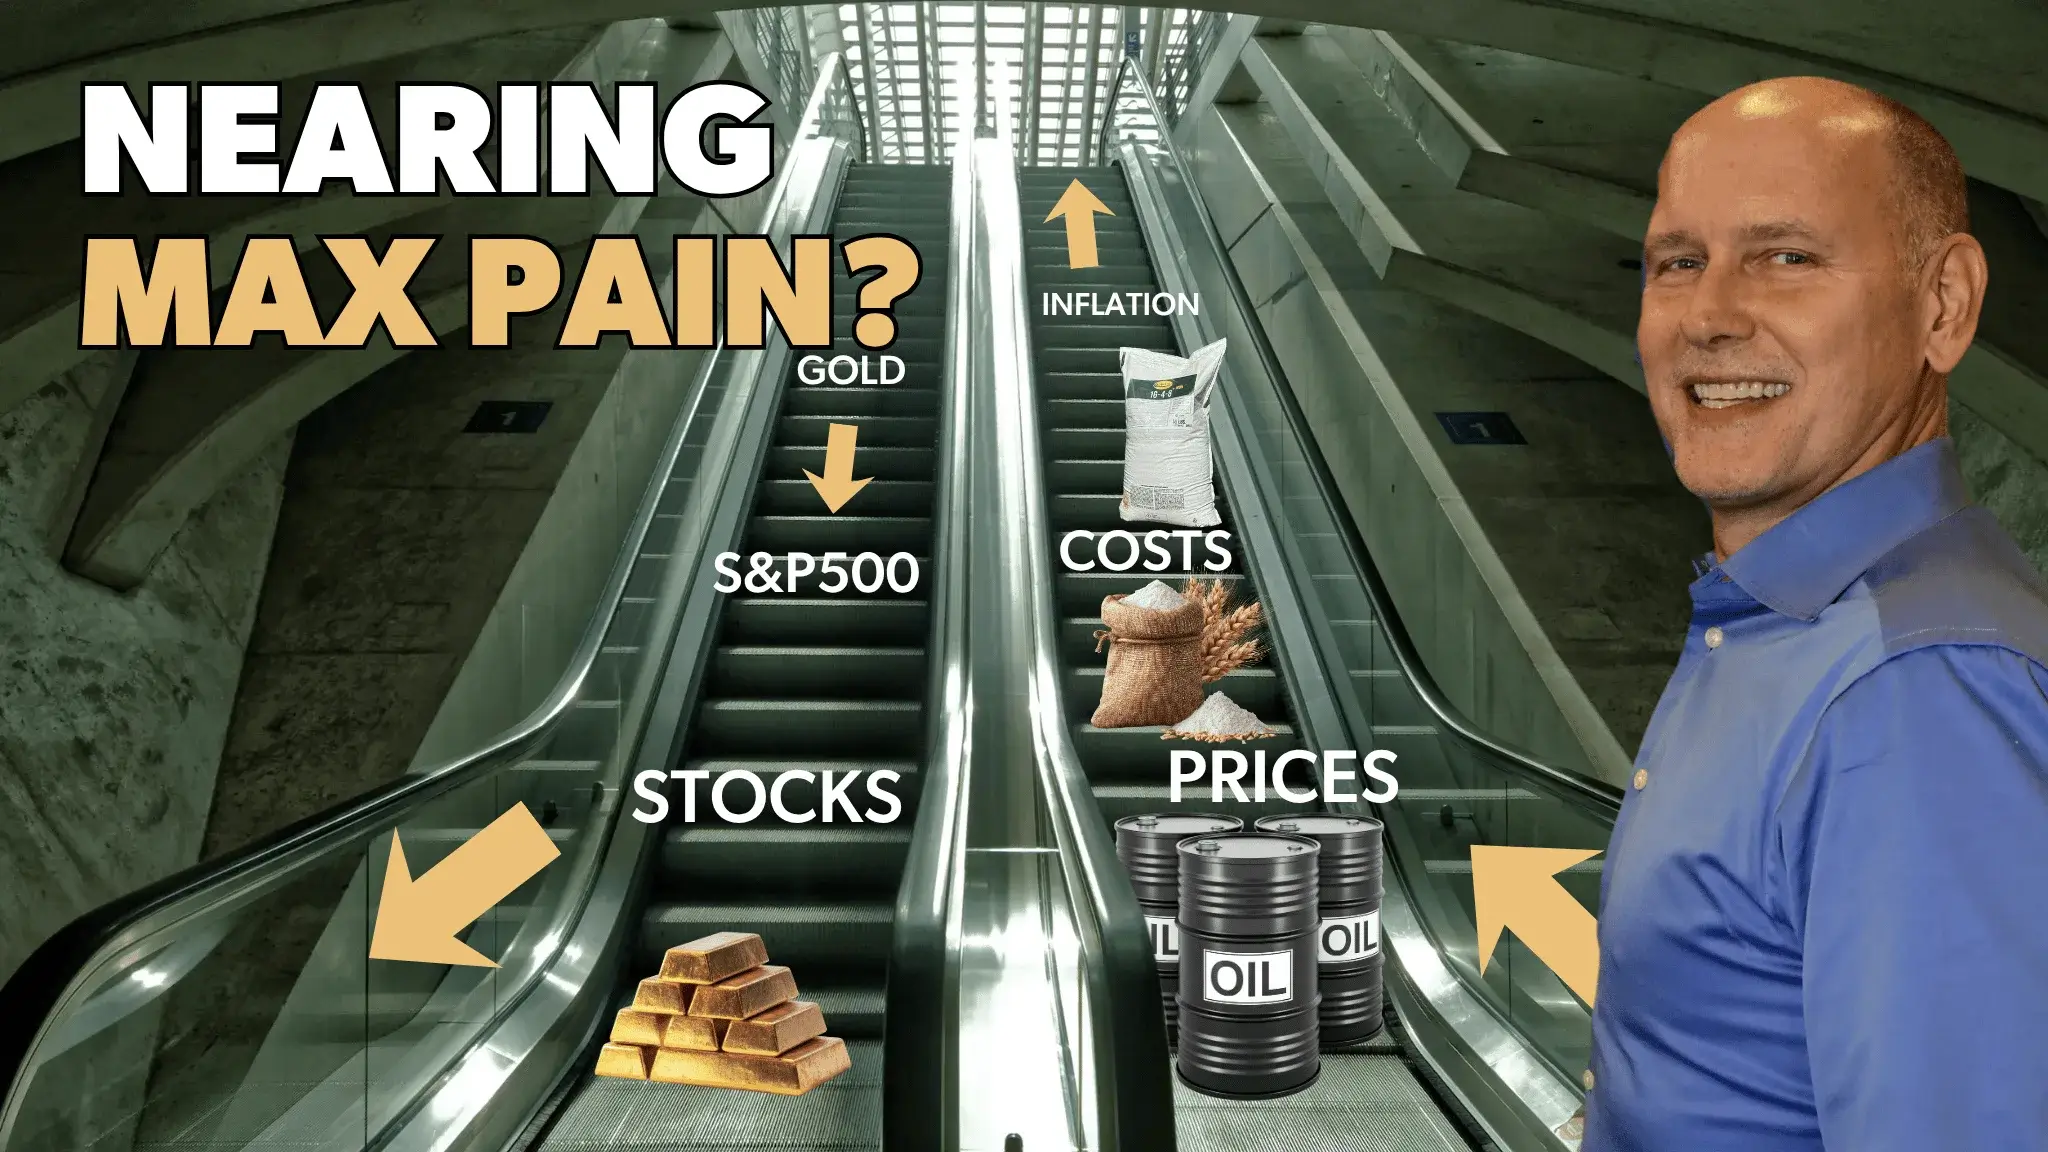
So, investors, it’s been a long week. It seemed to be more of the rinse and repeat, so I’m going to do a bit of a recap. I’m going to cover equities, bonds, inflation, geopolitics, and the ongoing AI transition — with a focus on what is mattering for your portfolio. The Bottom line remains, the S&P 500 peaked early November last year and has gone nowhere overall. Markets have been pausing and consolidating— not breaking —but the inflation pressure our team saw to start the year is building, oil and energy markets have been the recent reason. 1) U.S. EQUITIES Let’s start with stocks Last week March 6th through March 13th was a broadly down week..it’s third down week in a row. S&P 500: >-1.5% Dow Jones Industrial Average: >-2.25% Nasdaq Composite: about -1.25% So — year to date: January 1st through March 13th S&P 500: about -2.5%% Dow: about -3% Nasdaq: about -4% Not great but not horrible given rising concerns of slowing growth and higher inflation What does this sloppy action for 5 months tell us? It says to me digestion so far, not a downtrend. It’s pretty normal behavior after a v-bottom like April 2025 but it’s not enjoyable at all. We have been and remain in a sideways, rotational market for almost 6 months. What drove the week: First — inflation data came in higher than most expected and that’s before Iran conflict and that pushed rate cut expectations further out. Second — oil prices surged, driven by escalating tensions in the Middle East that have extended beyond Iran. Third — rotation continued. Money moved out of mega-cap growth and into energy, healthcare, and income stocks Our Takeaway so far is this is classic mid-cycle consolidation. Call it the 6-7th inning stretch. Not a selloff. A reset, so far. 2) BONDS & INTEREST RATES Now to bonds and fixed income. And unfortunately, as it has most of 2026, The bond market continues to send a very clear message: Rates are likely staying higher for longer…

Go Time: Stock Talk Update, Friday March 13, 2026
Is the market finally ready to move again? After months of volatility, geopolitical headlines, and sideways trading, many investors are asking the question: What comes next for stocks? At Oak Harvest, our 2026 outlook was titled “It’s Harder Being a Bull Rider in Some Years.” In that report, we outlined two headwinds and two tailwinds for stocks in 2026. Now that we’re a few months into 2026, it’s worth asking the question: How many of those themes are actually playing out? The first headwind we discussed for 1h2026, a rise in inflation expectations early in the year. Viewers, please go check the recording of our market summit outlook highlights if you doubt us. Now, did we predict an invasion involving Iran? Of course not. But what we forecast unfold a sharp rise in inflation breakeven expectations, right in the timeframe we highlighted. Take a look at the chart. Here’s the 1-year breakeven inflation chart. You can see the move higher by the bond market. Inflation expectations have moved up and to the right, however the pattern is now showing what looks like a very normal seasonal peak around the second or third week of March. So from a market narrative perspective, the inflation fear box has already been checked. That development has played out as our team expected. Now let’s move to the second headwind we outlined for the year. 2026 is a second-year Presidential cycle year. Historically, midterm election years tend to deliver positive returns overall, but they often come with higher volatility and more exaggerated seasonal swings. And that’s what we’ve started to see. Let’s look at the chart. Here’s the VIX index, which many investors use as a proxy for stock market volatility, covering the period from the fourth quarter of 2025 into the first quarter of 2026. During the recent Iran war headlines, the VIX briefly jumped from around 15 to over 30, essentially doubling from its previous levels. So again, we expected a volatility spike in the first half of the year which has now…

Citrini Research: The Talk of Wall Street. Stock Talk Update, Friday February 27, 2026
Every few years, Wall Street writes a research piece so provocative that everyone reads it. This week, we got such a piece from James van Geelen of Citrini Research and Alap Shah. Here’s a link to their very well written “thought piece”. https://open.substack.com/pub/citrini/p/2028gic?utm_campaign=post-expanded-share&utm_medium=web Their question: If AI continues exceeding expectations…Could that be very, very bearish for the economy? First off, this is not OHFG current view of the AI world and how it progresses through the economy, but this article has gotten so much attention with institutional investors, we wanted to share it with our followers. Please remember, Geelen explicitly says that this was a scenario analysis and not their prediction of where abundant AI compute could lead the USA economy into a spiral of: Accelerated White-collar unemployment Higher Mortgage default rates Increased consumer credit and credit card strain Political pressures in DC to fix the problems And potentially a 2027–2028 recession With trading desks in NYC thinly staffed for the blizzard, computers took over, and markets reacted immediately Monday morning. Several stocks mentioned in the piece dropped more than -10% Monday. Let’s walk through some of the piece. But the whole thing is worth reading if only to get you thinking. The Core Thesis: Abundant Intelligence The piece starts out in late 2026 when everything looked perfect: S&P500 near 8000 Nasdaq above 30,000 Unemployment was low and AI investment accelerated throughout the year Before I move on, investors think of this, the S&P500 at 8000 is +16% higher than here, and NASDAQ 30000 is over 31% higher! But guess what, this part of the author’s piece wasn’t focused on. No one I saw even mentioned it. They all jumped right to the doom of 2.5 years out. As if that were a forecast set in stone. So, the core of the piece projects out 2.5 years and imagines the economy in June 2028. Unemployment hits 10.2%. The S&P 500 is down -38% from its October 2026 highs as frequent followers of Oak Harvest content know, is a recessionary move…
Rotation Nation – Look Before You Leap: Stock Talk Update, Friday February 20, 2026
Year to date, the U.S. equity market — as measured by the S&P 500 — is essentially flat as of this filming. However, beneath that flat headline number, we’ve seen one of the widest dispersions in returns that I’ve witnessed in over 30 years of managing money. But underneath that flat headline number, we’re seeing one of the widest dispersions in returns I’ve witnessed in over 30 years of managing money. Let’s look at the table. We’re comparing year-to-date returns for the S&P 500, the Nasdaq Composite, the Dow 30, the Russell 2000, the Russell 1000 Growth Index, and the Russell 1000 Value Index. I’ve selected the S&P 500 as a broad, market-cap-weighted benchmark most investors understand which is essentially flat. The Nasdaq Composite serves as a large-cap growth proxy is down -2.75% The Dow 30, which is price-weighted rather than market-cap-weighted, tends to represent more dividend-oriented and stable growth companies is up over 3%. The Russell indexes capture small-cap exposure and growth versus value distinctions. These are often found in 401(k) lineups and broad equity allocations. What Does the Table Show? Smaller-cap value stocks are leading the U.S. performance tables — up over +6% year to date. Large-cap growth stocks, on the other hand, are negative — down approximately -2.75% year to date. That’s significant dispersion — in just the first seven to eight weeks of the year. Factor Perspective Now let’s take this one level deeper. Instead of looking at indexes, let’s examine returns through a factor lens. By “factor,” I mean characteristics of stocks — not industry or market cap — but traits like: Value, Growth, Quality, High dividend, and Low volatility Here is the year-to-date performance table based on factor groupings from Seeking Alpha, using publicly traded factor ETFs. What stands out? The best-performing factor year to date is high dividend yield. Second best: dividend growth. What do these share in common? They are defensive. These areas tend to be defensive. They typically include companies in slower-growth industries that offer immediate shareholder returns through dividends. When…