

Real Interest Rates vs. Stocks: A Dangerous Shift?
I’ve been asked a number of times why I focus so much on real time real interest rates? Which is the spread between nominal interest rates and real time breakeven inflation interest rates? It’s the premium a Treasury bond investor demands above inflation for holding US Treasury bonds. This will be a quick video on this subject and its history the last few decades. Mainly post QE, Quantitative easing which is post GFC in 2008/9 and before that period. Let’s look at the most recent 1o015 years post great financial crisis and the onset of the Feds “QE, quantified easing programs” where they used their balance sheet to buy and sell Trillions of dollars of Treasury and MBS securities. Here’s a 10-year weekly chart of the SP500 with the significant lows circled as well as the last major top in last 2021, early 2022. Let this chart sink in for a bit. From the lows in early 2016 to the current highs in early 2025, +240% in total return for the S&P500 compounding at over 14% per year, but yes significant drawdowns including the Covid recession of -35% and the earnings recession of 2022 which the S&P dropped over -25% and 0ver -35% in real terms including inflation. Ok now here is the chart over the same time for 5-year real-time real interest rates. Basically, this is the 5-year Treasury yield minus the 5-year Breakeven inflation rate. These aren’t surveys of investors. These are real-time market pricings which often are not aligned with surveys. When making investment decisions, I will take market data over survey data 9 out of 10 times because I’ve found surveys usually gauge “feelings” and more often than not, investing based on one’s feelings leads to poor investment outcomes. What you’ll notice is that overall, in general, since the Great Financial Crisis ended and the Fed started QE, that lower trending “real interest rates” have been better for the markets and higher trending real rates have been bad. The peaks in 5-year real rates have coincided…
Stocks Just Dropped 10%—Here’s Why the Weak Start to 2025 Might Be an Opportunity
Investors, this week we are back to charts and data series. Most will come in a quick rapid fire without lots of discussion, but most of them say the same thing. While uncomfortable and near historically quick, the recent -10%+ decline in the S&P500 has not yet said the bull market for US equities is over. Recall, the average decline in any year is a little over -13% and historically, rapid declines of -10% have been followed by good gains in the next 6 to 12 months. First, 75 years of data from the folks at Creative Planning, showing max intra-year losses in the S&P 500 versus year end returns. You’ll note that the average loss in a year is over -13.5%, while the average year ending gain is still +11.6% up. As many times as our team tries to message this, I am compelled to do it again. Investors, there is no free lunch in the markets, except for historically the compounding over decades. You cannot get high returns without sitting through periods of high volatility. 2022 was a great case in point to the downside in higher growth stocks versus dividend names, while the follow-on years of 2023 and 2024, showcased the higher compounding of growth stocks versus dividend names. 2025, YTD the markets have reverted back to slower growth, higher dividend names outperforming and higher growth names pretty dramatically underperforming. Great data from Ben Carlson on the drawdowns in the S&P 500 over the last 75 years. This is the 39th >-10% decline, and there would be considerably more if the data did not use closing high and low prices, but instead of low and high levels. Here’s the data from Seth Golden showing, historically, swift and fast down, has been followed by very profitable investment returns over the next 3,6, and 12 months. Here’s the current 10-year chart in the S&P 500, which into Dec 6th, 2024 and early 2025 had compounded at a little over +11.5% per Year. Investors, please note that includes around 15…

Feeling Uneasy about the Stock Markets? Watch This
Investors, in the next 10-15 minutes we are going to dive into a few things our team looks at in the markets that historically have led to market moves. Several of them are just fun historical facts that keep repeating, and others are the usual real time data series that our team keeps discussing time and time again. The good news is that virtually all of these “indicators” are aligning to say the typical 1st year presidential term, 1st quarter sell off should be behind us and greener stock prices are ahead. However, I remind investors that we have anticipated that the first 2-3 quarters, not weeks or months in 2025, should see higher volatility than both 2023 and 2024 and of course that’s EXACTLY what has happened last month. Let’s start with the fun facts, the ones only insiders know. Well, the first one is in my investment career, almost all major stocks selloffs have happened. When I’m on a multi-day pre-planned vacation. This year, 2025, of course has proven that factoid a “money trade” once again. Left for NYC Wednesday Feb 19th, which was the closing high for the sp500 at 6144 and the market promptly dumped. Left for Florida, Friday March 7th and returned to the office Thursday March 13th which so far is the closing low for 2025 at 5521. Folks, this isn’t just a one-year thing, It’s happened time and time again for 25 years. Maybe it’s because I tend to take vacation in the seasonally weakest time of the year for stocks, Mid-Feb through mid-March or maybe its just just bad luck, but its happened time and time again for years. And clients and financial advisors ask me why I never take vacation? Well, no you know one of the reasons, and no money never sleeps even while you’re on vacation. The good news for investors, I have no significant planned vacation again until? Feb 2026! Almost an entire year from now. I know many of you might laugh at this, but if you…

2025 Stock Market: We Never Said it Would be Easy
Investors, there are no guarantees in the stock market, and the first two months of 2025 are proving that a lesson to those who just entered the markets the last 2 years and enjoyed +20% returns. It’s been a sloppy, choppy mess which while uncomfortable to those watching day to day or week to week, as we previously warned, 1- is not unusual and 2- likely to be the case for the first couple of quarters of 2025. Here is a 2-year chart of the SP500. I’ve drawn the general upward sloping channel we’ve been in for that time period. On the chart you will see we traded outside this band in October of 2023 for about a month as many were preaching the end of the bull market, recession, Elliot wave Theory Generational tops, or the biggest nonsense I recall at that time, the coming of a replay of the 1987 stock market crash. We felt none of those things were going to happen and were coaching our followers to be buyers of stocks. You’ll see the mid-summer pullback in July and August 2024, caused by the unwind of the Yen carry-trade delevering, pretty much on cue for normal summer selloffs. And you will see the gap higher in early November as Donald Trump won a landslide Presidential victory. Which brings us to the present, the first two months of 2025. January went up 2.7% and February down -1.42%. Here’s the SP500 seasonality matrix for the last 10 years from Bloomberg. You can compare prior years including the first DJT term. However, the more important data set in my eyes, is the one we’ve presented for a number of months from the quant team and Steve Suttmeier’s group and BAC/Merrill Lynch. It’s the monthly average seasonal returns under the first year of a presidential cycle since 1929. Here’s that data. As one can see, historically speaking, the first two months of the first year are underwhelming “net”. In fact, the whole first quarter was historically sloppy and choppy. So…

Friday Fights and Stock Flights
I forgot to warn all our followers that I was taking a few days off in NYC late last week and most years when I do this if February, the markets sell off hard. Well, looks like history repeated as the S&P 500 sold off in a near straight line down last Friday over 100 S&P500 points or almost -1.75% on weaker economic data and higher consumer inflation concerns. The worst data point last week was the University of Michigan’s survey showing that consumers’ long-run inflation expectations rose the most (0.3 ppts) in nearly four years and to the highest level (3.5%) in over 30 years. We discussed this near exact same economic weakness, and ongoing slowing fast trend 2-3 weeks ago in our “Behind the scenes, what many on TV won’t tell you, the economy is slowing fast” video, giving numerous reasons including the ending of the Biden fiscal stimulus sugar high as well as increased uncertainty and economic concerns of the Trump DOGE programs causing increased unemployment and dropping consumer sentiment and retail spending, Here’s an updated chart on 2-year real-time real-interest rates. As we’ve mentioned for the last few months, down and to the right are growing, but slowing fast. As one can see, there was a summer peak last year in growth expectations right as the Biden fiscal spending plan peaked in front of the election, and it’s been down ever since. Slowing until late December when the rate of decent picked up steam. Yes, it’s most likely, that this recent rapid slowdown in growth has been caused by the weekly Trump administration shock and awe policies, usually on Thursday afternoon or Friday, on tariffs and government job firings. Whether one agrees with these policies or not, from an economic perspective as well as a stock market perspective, they cause short term uncertainty for our US consumer led economy and spending slows along with corporate investment plans. Usually until companies know that the rules are set and won’t change week to week. At the same time…

Bad News for the Bears: Running with the Bulls and Winning
I know last week’s video was a bit of a downer. Bringing bads news percolating behind the scenes in the economy that many in the media won’t tell you about. This week, it’s back to, good news, yes Virginia there is a Santa Claus, and he’s riding his sleigh in a bull market for equities still. Let’s just retitle the 1976 sports comedy for this week title, and call it “The Bad News for Bears. We looked at the data behind the data last week to show our followers that the economy is losing momentum quickly. However, slowing doesn’t mean shrinking. This week there is a few quick hits on the continued bullish setup for stocks for 2025. Let’s start with the obvious. As of this writing, the S&P500 was sitting at a closing daily high of 6114, within a few pints of all-time highs made back on my b-day, Dec 6th. There a few hedge fund and tradingisms that come close to always rules in the stock markets in my book. Let’s start with the biggies. First, price is truth. You may not believe that price is the “right price”, but the markets are bigger than any one opinion and they collectively believe we deserve to be at or near new all-time highs in the markets. Here’s a chart on daily SP500 the last few years, since the pivot lows in October 2022. I’ve drawn a upward sloping channel around the bands weve traded in since and circled a few key lows, like the late October 2023 low when the hysteria was high around recession or duplicate crashes like 1987 or when many EWT, that’s Elliot wave Theorists, panicked and got emotional and biased and decided to stop following charts and start trying to call generational tops. I circled the mid-summer swoon last year caused by the yen carry trade blowup. And regardless of the short term trama, news event, election outcome or goings on, here we sit within a few points of all-time highs. Even more interesting here’s…
Slowing (fast) but Growing Bidenomics Mirage?
I’m here to break some news most on financial TV or in the media don’t know or won’t tell you. The American economy is slowing, which is normal after the consumer led holiday season, however it’s slowing pretty rapidly. As usual, Ill give you a little real time data as well as warn investors away from focusing on or even believing the short-term government data releases that so many in the media, most who have never actually managed money but rather reported on instead, seem to like to focus on. The data is pretty clear, whether you believed in Bidenomics and the prior administrations horribly named “IRA” spending program nearing $900 billion, it provided a short term economic stimulus in 2023 and the first half of 2024 in front of the Presidential election. While grossly overstated, I’ll come back to the real data in a bit, the job market has been relatively good and stable. The unemployment rate has stayed near historic lows over the last 2 years. And while every job counts for our economy, and we would rather have more people employed than less, the types of jobs and type of employer matter greatly in the strength of the economy. Looking at the data behind the data, you know the real data that comes out 12 to 18 months after all the revisions and government adjustments, one finds that the vast vast majority of jobs the last tow years have in in 3-4 areas that are not really private sector dependent and rather mostly subsidized by taxpayers. Th biggest job gains outside of the service travel and leisure sector have come from government hiring, education, which is also taxpayer funded, and healthcare, which for the most part is also taxpayer reliant as Medicare and Medicaid spending drive so much of our nation’s healthcare demand and costs. We’ve discussed for the better part of 15 months the overstatement of the strength US jobs market by the Department of Labor. Once again, we will reference the tremendous work that HEDGE…

Tariffs: Shock and Awe
I’m trying to keep this one short as last week was a blur with loads of earnings calls and Oak Harvests first half market summit last Thursday night. There’s a link in the description below to the portion of the event we livestreamed over YouTube for clients and one-line guests. We covered a lot of ground over an hour and a half from interesting stock, bond, and currency market topics to ongoing economic events and of course a few of the things going on in Washington DC, including taxes, tariffs and immigration and what those things could mean for volatility in 2025 and your money. And sure enough, almost on cue, around lunch time Friday, with every other stock market in the world closed, White House press secretary Karoline Leavitt, took to the podium and announced the US President Donald Trump will impose tariffs on Saturday of 25% on Mexico, 25% on Canada and 10% on China. Later Friday, President Trump said that Canadian oil would be hit with lower tariffs of 10%, which could take effect later in February. The President also said he planned to impose tariffs on the European Union in the future, saying those countries had not treated the US well. And what did the US stock markets do, the computers, algorithms, and short term traders took over and the SP500 rolled over and went from up about +.5% to down -.5% in nearly a straight line and instead the S&P500 closing the week at a new weekly ATH on the back of strong earnings reports, lower interest rate yields, and a lower dollar, it closed the week down and chartists will likely start talking “Double top formations at 6100”. Heres’ the Daily, 5-minute chart of the SP500 for last week with Friday’s press conference timing noted as well as the move down in the cash SP500. And here’s the same Daily, 5-minute chart of the Vix, volatility index for last week with Friday’s press conference timing noted as well, with its move up also noted….
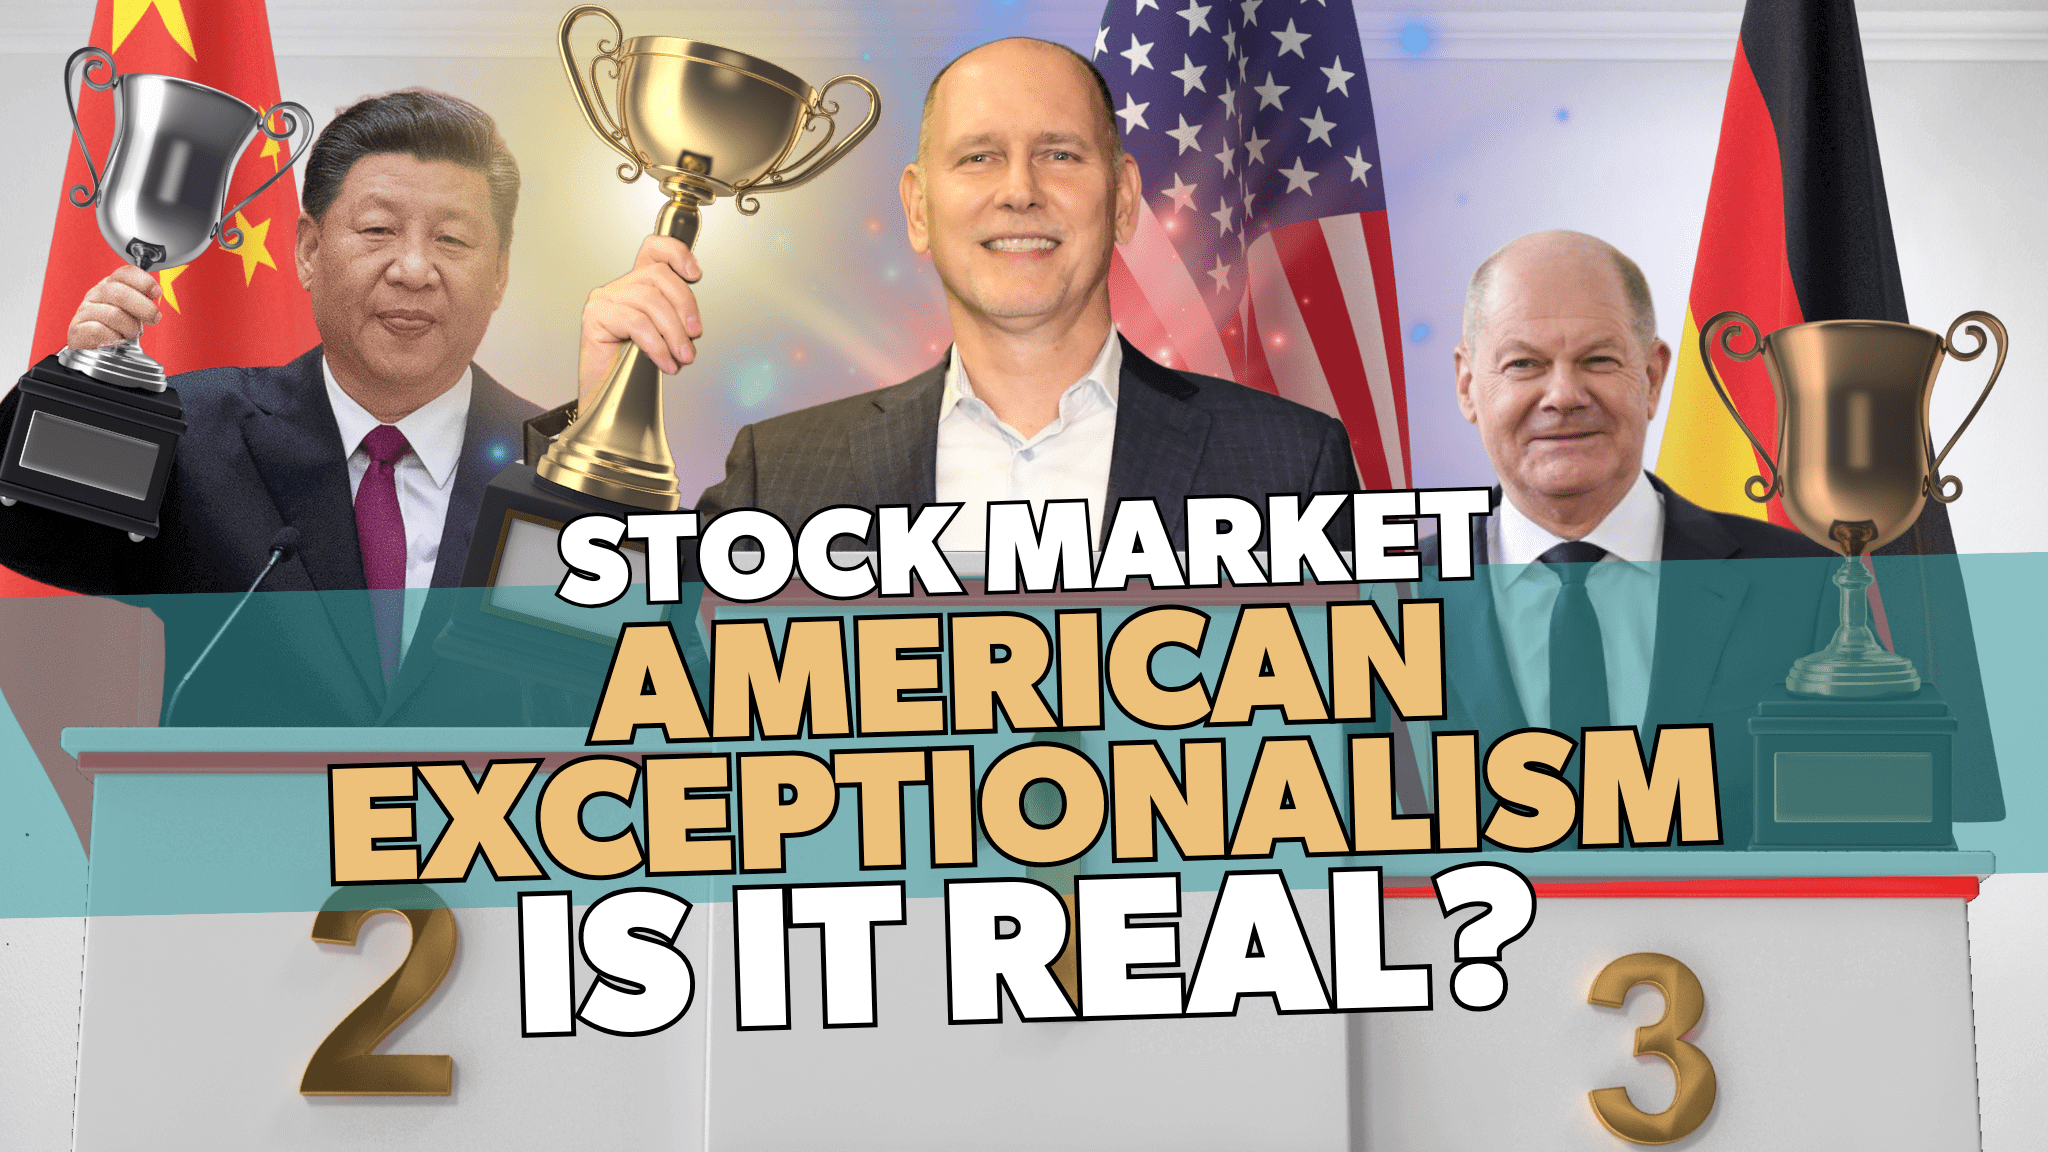
American Exceptionalism: 2025 Soft Landing
I want to apologize for missing last week and giving you some market content. We had a 50 year historic snow event here in Houston mid-week which kept us from filming, as well as postponing OHFG’s first half market summit from Thursday the 24th to last night, Thursday the 31st. There’s a link in the description below to the portion of last night’s event we livestreamed over YouTube for clients and one-line guests. We covered a lot of ground over the hour and a half from interesting stock, bond, and currency market topics to ongoing economic events and of course a few of the things going on in Washington DC. Before we get into this weeks topic, I want to briefly cover a term that has been thrown around in the financial markets now for about 3 months, the term “American Exceptionalism”. It’s largely being used to try to describe to investors why American stock markets have outperformed most of the worlds the last decade plus. Why a diversified portfolio of global stocks has lagged the S&P500 performance for not just last year, but for most of the last few decades, since the great Financial Crisis. Many are siting technology stocks and innovation as the reason for US exceptionalism. To me the answer is easy, investment capital likes capitalistic leaning countries and their economies regardless of how flawed they might be over, socialist, communist and dictator-controlled countries. They like markets with the rule of law over markets where the government elected officials or worse yet dictators control their economies. At the end of the day, money goes where it is treated best and where there is less friction, be it government interference and political decisions, or higher taxes, and regulations. At the end of the day, here in the US, your money is green, not colored blue or red. So quickly, this weeks investment content as our team has been busy listening to and digesting the waterfall of earnings releases from many of the largest most well know companies in…

Top Reasons for a Weak Start to 2025 in the Markets
In this video I’m going to quickly cover why the first 2 weeks have started off on a down note for most equity markets. I am also going to cover why it is not yet overly worrisome from a historical perspective when the economy is in the 2nd or third year of a “soft landing” after experiencing 1-2 years of significant gains. Before I get into this week’s topic, I hope that you join us on January 23rd, at 630 PM central via YouTube as OHFG is hosting our first half market outlook and will be livestreaming a good deal of the evening. I’ll drop a link for registration in the description below and please feel free to submit any questions you might have that you would like the team to touch on in the comment section of this week’s video. The US stock markets represented by the SP500 have started out 2025 on a down note. After gaining over +23% in 2024 in price and about +25% in total return including dividends, the S&P 500 is down about -1% year to date, However investors, since reaching its absolute intraday peak near 6100 on Friday, December 6th, my 59th Birthday, the S&P 500 has declined about -4.36% from its closing high that day to this writing. And with that, many of the usual suspects have come out of the woodwork with their annual “crash cart” calls. Whether they will finally be proven correct after 10-15 years of the same call, I don’t know. What I do know, is our next has discussed this kind of possible downward action to start 2025 since early December. Why? Because soft landing economic scenarios do NOT guarantee constant upward trending stock markets with low volatility. How do we know this? History. As we have discussed for the better part of 15 months, the last time the Fed was able to commandeer a true soft landing for the economy and stocks was 1994-97 under Alan Greenspan. Greenspan raised rates in 94, cut rates by 75…