


S&P 500 Why Not Much Higher? Stock Talk Update, July 17, 2026
Good evening, everyone. Here’s something that does not seem to make sense to many investors about the US stock market, S&P500, the last 2 months. Over the last 6-8 weeks, nearly every major Wall Street strategist has raised their year-end target for the S&P 500. Citi.Goldman Sachs.Morgan Stanley.J.P.Morgan.Barclays. Most now see the market finishing 2026 somewhere between 7,800 and 8,100. There actually are a few optimists that have ratcheted targets up to nearly 8500. So here is the obvious question. If now stocks should be worth more, why has the market not already ripped higher? After managing equity portfolios for more than 35 years, I would tell you there are likely two big reasons. Neither has anything to do with weak earnings. But both have to do with real-time market valuations. So here we go, the first point – Overall S&P500 EARNINGS look OUTSTANDING, accelerating and heading higher 2-3q26, BUT CASH FLOW IS UNDER PRESSURE. Let’s start with the good news. Corporate America is making money. FactSet estimates second-quarter S&P 500 earnings growth at 23.6%. If that proves accurate, it would be the second consecutive quarter above 20% earnings growth. Goldman Sachs also expects another strong quarter, supported by a solid macro backdrop and the ongoing AI investment boom. That is the bullish part of the story. But it seems like investors are already looking beyond earnings. They are asking a second question: how much cash are these companies actually keeping? Today’s AI leaders are spending enormous amounts of money on data centers, GPUs, networking equipment, and power infrastructure. Those investments may create major future growth, but they can reduce free cash flow today. Goldman notes that hyperscaler capital spending estimates rose by more than 100 billion dollars after last quarter’s reports. Investors are no longer asking only whether AI revenue is growing. They are asking whether this spending produces an acceptable return on capital. That is the critical distinction. Earnings can rise. Revenue can rise. But if every dollar is immediately reinvested, shareholders may not see the cash flow…
Everyone’s an Economist… But Does It Help? Stock Talk Update, July 9, 2026
Two Key Takeaways Economic data is valuable—but it isn’t perfect. Most government economic reports are backward-looking, frequently revised for months, and often give investors a false sense of precision. Successful investing isn’t about predicting every economic statistic. It’s about identifying the handful of factors that actually drive long-term stock prices—earnings, valuations, interest rates, and investor expectations. Good evening everyone. Have you noticed that these days… everyone seems to be an economist? Every jobs report…Every inflation report…Every GDP release… Within minutes, thousands of opinions appear telling you exactly what it means for your investments. I had all those classes and went to a pretty good school for an MBA and after 35 years managing equity portfolios, I’ve learned something very different. What’s that? You don’t need to know everything, or much of anything about macroeconomics to become a successful investor. In fact, trying to predict every economic data release can actually make you a worse investor. Tonight, I’d like to explain why. POINT #1ECONOMIC DATA ISN’T AS PRECISE AS IT APPEARS Let’s start with last week’s employment report. This data is from Zerohedge who our team has relied on for almost 5 years to dissect, true up, and interpret the government stats. The headlines said the U.S. economy created only 57,000 jobs, roughly half of what economists expected. At the same time…The unemployment rate actually fell to 4.2%. How can job growth slow dramatically…while unemployment improves? The answer lies beneath the headline. The labor force shrank by roughly –720,000 people, causing the participation rate to fall to its lowest level in years. If fewer people are looking for work, the unemployment rate can fall even when hiring weakens. April and May payrolls were also revised a combined –74,000 jobs lower, reminding us that the first estimate is often not the final estimate. April was cut by -17% and May was even worse at a -25% adjustment down. the worst aspect of the jobs report was once below the surface, where we find that that the number of full-time workers collapsed by…
Market Timing – Are You That Good? Stock Talk Update, July 3, 2026
Two Key Takeaways Geopolitical events grab headlines, but earnings and interest rates ultimately drive long-term stock prices. History shows that investors who sell during geopolitical crises often miss powerful recoveries. Timing both the exit and the re-entry is extraordinarily difficult. The biggest risk isn’t enduring temporary market declines—it’s missing the recovery that often begins while the news is still overwhelmingly negative. OPENING Good evening, everyone and happy 4th of July weekend and our great nations 250 year B-day. I wanted to follow up on a topic that came up during our 2h26 market outlook livestream last week and address one of the questions we hear most often from retirees, that is: “Should I sell because of what’s happening in the world?” Russia. Ukraine.Iran.Israel.China.Taiwan. The headlines are frightening. Markets become volatile short term. And the temptation many retirees have is to “wait until things settle down” to invest or fight the urge to “go to cash” and try to market time. But tonight, I want to ask you one simple question. Are you really that good at market timing? Do you have a history of successfully executing this strategy? Because timing the market isn’t making one correct decision. It’s making two. You have to know when to sell…and you have to know when to buy back. History says that’s much harder than most people believe. All we have to is look at two recent examples the last few years. EXAMPLE #1 RUSSIA INVADES UKRAINE On February 24, 2022, Russia invaded Ukraine. Markets immediately feared: A European recession An energy crisis Runaway inflation Higher interest rates A global economic slowdown Many investors concluded that stocks had nowhere to go but lower. Initially, they weren’t entirely wrong. Over the next eight months, the S&P 500 declined 18.4%. But here’s the important point. The war wasn’t the primary reason stocks fell. The larger drivers were: A Federal Reserve raising interest rates at the fastest pace in decades. An earnings recession, as corporate profits temporarily declined vs. tough post Covid reopening comps. Those fundamental factors—not…
2H2026 Market Outlook Summit Highlights: The Market Is Up… But Volatility Isn’t Over
The biggest risk in a volatile market may not be the pullback itself — it may be the decisions investors make because of it. In this Stock Talk episode, Chris Perras and Charles Scavone of Oak Harvest Financial Group break down the major forces shaping the second half of 2026, including corporate earnings, peak earnings growth, interest rates, the U.S. dollar, a new Federal Reserve chairman, AI-related capital spending, and the excitement surrounding SpaceX. They also explain why earnings continue to be one of the most important drivers of long-term market performance, why volatility is a normal part of investing, and why trying to time the market can be especially risky for retirees and those approaching retirement. If you’re wondering whether to stay invested, adjust your allocation, or prepare for more market swings ahead, this conversation offers a practical look at what investors should be watching next. Transcript: 1H Review + Volatility Setup Troy I had to think about it for a second, because “Sometimes it’s hard to be a bull rider.” Oh, I get it. The market stock market being a bull rider. And first I have to say, I mean, you did a pretty good job as far as, what the expectations were heading into this year and then what actually transpired. So talk a little bit about what you meant in the first half outlook. And this is still on YouTube guys. If you want to go check this out. Our first half outlook sometime later. What did you mean when you said the bull is sometimes harder to ride? Chris Thanks, Troy. Yeah. So we sit down. Charles and I have been doing this, you know, for years. I guess I’m kind of the market historian on the team, so, I start a lot of steady, a lot of cycles there, try to come up with a catchy title for it. And just so happens, 2026, when we looked at all the data, whether it’s second year presidential terms or economic cycles, it looked like it…

2H 2026 Market Outlook Preview – “In Some Years, Bull Riding Is Harder”
Good evening, everyone. Next Tuesday at 6 PM Central, Troy, Charles, and I will be hosting Oak Harvest’s Second Half 2026 Market Outlook via YouTube livestream. Tonight isn’t our outlook. Think of this as the movie trailer. We’ll review what we expected coming into 2026, what actually happened, and what our team believes investors should be watching as we enter the second half of the year. The good news? Our primary outlook for 2026 remains intact. The bad news? If our outlook remains correct, the ride may get bumpier once again before this cycle is over. Our title for 2026 back in December: “In some years, bull riding is harder.” And year to date, 2026 has certainly been one of those years. PART ONE: LOOKING BACK: HOW DID THE FIRST HALF OF 2026 PLAY OUT? Let’s start with the scoreboard. The S&P 500 is up roughly 10% year-to-date. Sounds easy. It wasn’t. During the first quarter investors endured a 6 week and roughly -10% correction tied to the Iran conflict. Since that low, the SW&P500 has rallied more than +20%. We warned investors about market volatility in our original 2026 outlook. Not a bear market. Not a recession. But a bull market with more volatility. A bull that tries to buck investors off its back. And that’s what we got in the 1h26. But in reality, this kind of move lower isn’t unusual. Let’s revisit Charlie Bilellos data on market downturns and their frequency. One of the biggest mistakes investors make is assuming volatility means something is broken. History says otherwise. Average frequencies of market declines. These occur even in secular bull markets. A -5% decline happens almost every year. A -10% correction happens roughly every 18 months. A -20% bear market occurs about once every four years. Volatility is normal. Not enjoyable for most, but normal. It’s the admission price for long-term stock market returns and trying to compound your savings above inflation. WHAT DID WE GET RIGHT? Back in December our team highlighted three major tailwinds. Number one:…

When Good Isn’t Good Enough: Stock Talk Update, June 13, 2026
For years, investors have been told that strong earnings are all that matter. This earnings season reminds us that in the stock market, strong results alone are often not enough—stocks react not to earnings themselves, but to how those earnings compare to expectations already embedded in stock prices. Four Key Takeaways Earnings season was outstanding, but several stocks still fell. Investors didn’t reward “good” results. They were only rewarded with results that exceeded the very highest or those who jumped over a very low bar. And low expectations. Profit margins remain near record territory. Companies continue demonstrating pricing power and operating leverage despite higher interest rates and ongoing economic uncertainty caused by the Iran war. Technology, Energy, and Materials are driving earnings growth. The Health Care sector remains the major laggard as earnings estimates continue moving lower. Overall, SP500 earnings outlook is accelerating, not slowing. FactSet now expects more than 20% earnings growth for the S&P 500 in Q2, Q3, and Q4 of 2026. OPENING Good evening everyone. This week I want to discuss a lesson that every investor eventually learns: Sometimes, Good isn’t always good enough. In fact, some of the biggest stock declines this earnings season occurred after companies reported results that most investors would consider excellent. Why? Because in the short term, stocks don’t always move based on whether earnings are good or bad. Many times, over shorter-term earnings period, stocks move based on whether earnings are better or worse than the margins buyer or seller of the stock’s expectations. And right now, expectations, especially for artificial intelligence, semiconductors, and technology companies—the expectations bar has become extraordinarily high. The latest FactSet Earnings Insight report from June 6 offers a useful big-picture snapshot of the current earnings environment. The outlook for S&P 500 earnings remains very strong over the next few quarters. Even so, several market favorites sold off after reporting first-quarter 2026 results. Today, let’s look at what happened and what it may mean for investors going forward. POINT #1: S&P 500 EARNINGS SCORECARD – FUNDAMENTALS REMAIN…

Dot-Com Era (Oct. 1998–Mar. 2000) vs. Today (Apr. 2025–Current): 10 Similarities and Differences
The OHFG investment team has been talking about the AI vs. dot-com cycle for more than a year. We were early in recognizing AI’s capital-spending buildout and the similarities between the two periods, and we saw the comparison as encouraging even while many others worried the market was nearing another bubble peak. At the highest level, both periods were driven by the belief that a major new technology would reshape the economy: October 1998 post LTCM-2000: Internet and telecommunications April 2025 post Tariff Tantrum-2026: Artificial Intelligence (AI) capex boom Let’s start off with the 3 charts we’ve shown for over a year. Overlays of the SP500, the SOX semi-index, and the Semi equipment indexes (the most leveraged capex sector I could find dating back to the time period. Our starting points have been October 1998 LTCM blowup and the April 2025 Tariff tantrum selloff. Each were down -21% peak to trough. Maybe it’s the wrong starting point, but so far, its hard not to see the similarities in both its accuracy and precision. SP500 INDEX SOX INDEX SEMI EQUIP INDEX The biggest difference is that the economy in 1999 was growing faster and operating with lower inflation, while today’s economy faces higher inflation, heavier government debt, and more geopolitical uncertainty. From October 1998 through March 2000, investors poured money into internet stocks. Today, investors are pouring money into artificial intelligence. As someone with 35 years of equity portfolio management experience, let’s compare the two periods. Our team is here to give you 10 similarities and differences to consider. Technology Revolutions each period Similarity In both periods, investors believed a new technology could reshape the economy. In 1999, that technology was the internet and the wireless data buildout. In 2025–26, it is AI and the capital spending tied to data centers and energy infrastructure. Difference Back in 1999, many public internet companies had little or no revenue or earnings. Today’s publicly traded AI leaders—you know the names—are highly profitable and throwing off substantial cash flow, albeit no longer Free cash flow….
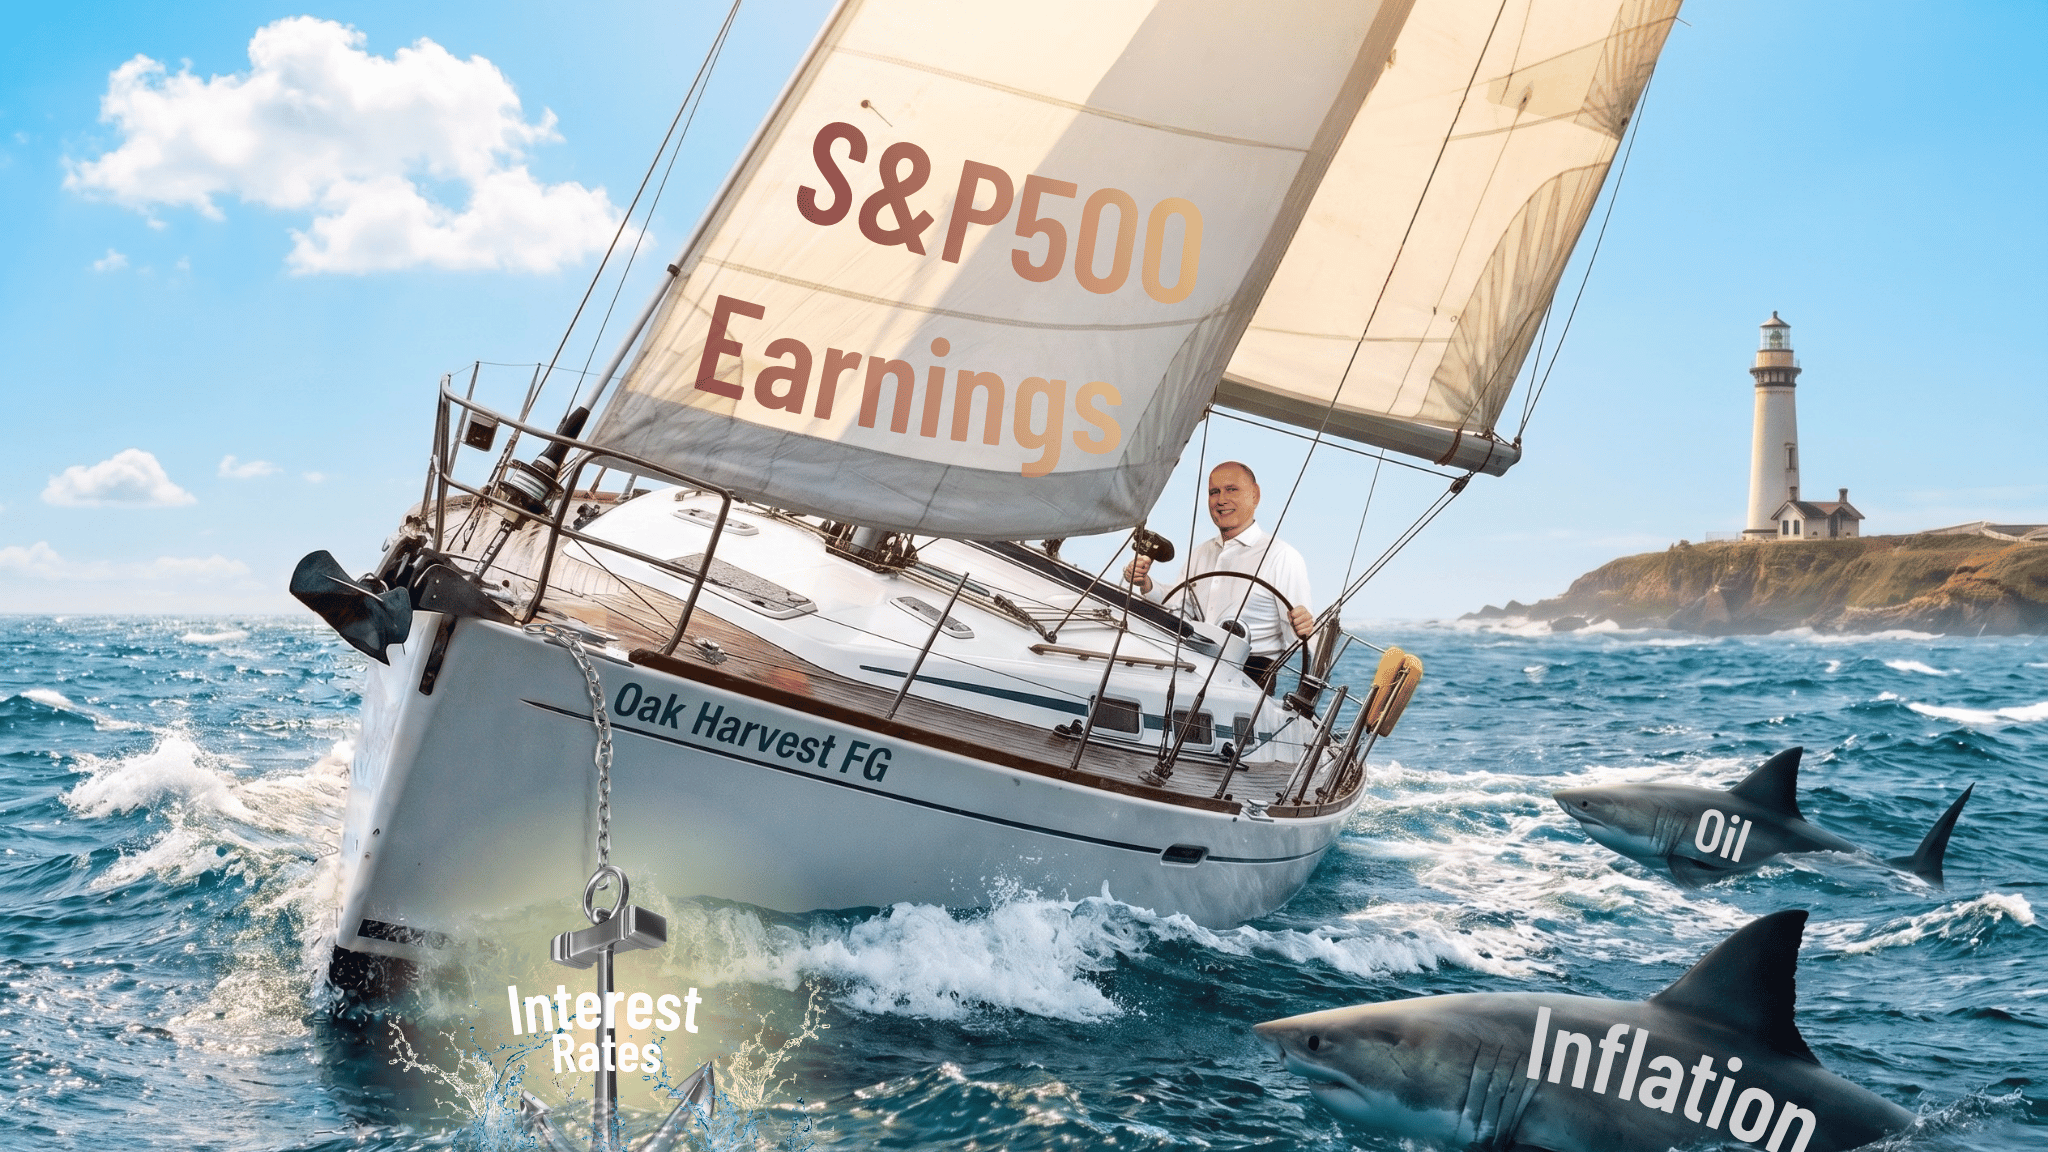
Interest Rates: A Headwind, not a Roadblock to Growth Stocks
Introduction So here we are again, interest rates are rising and many are issuing dire warnings for you and your money…so you are probably asking Can my stocks—especially growth stocks that have led this rally—keep moving higher? Here’s the key insight our team wants to stress again, Revenue growth, earnings, earnings growth, and earnings revisions and not interest rate are currently driving this stock market. 1. Earnings Are Overpowering Rates At this filming, the revenue growth rate for the S&P 500 for Q1 is 11.4%. On December 31, the estimated revenue growth rate for Q1 was 8.2%. On March 31, the estimated revenue growth rate for Q1 was 9.9%. Clearly, overall, the 1q26 was stronger than analysts first thought. As of FactSet’s last data update, Q1 2026 earnings growth: +27.7% (highest since 2021). 84% of companies beat EPS estimates, Margins at record highs (14.7%) with 10 of 11 sectors showing growth led by technology and energy with 2026 EPS set for about $335/s and 2027 at around $385/s and trending higher fast. **Bottom Line: For the overall SP500, Revenue, Earnings and Earnings growth is accelerating faster than interest rates are rising offsetting some compressing valuations and PE multiples. Another Factset chart showing that we are currently trading at around a 21-21.5x Forward PE on the S&P 500, middle of the 5 year range even though EPS are hitting material new ATH’s and interest rates are at new yield highs not seen in 15 years. 2. Understanding Interest Rates Remember that there are 2 components to those nominal interest rate yields that are constantly discussed on TV. The nominal yield equals the sum of the markets Real interest Rates + Inflation Expectations. While many in the financial news are discussing the notion that the rise in yields is being driven by rising inflation expectations, the real-time market data is saying quite the opposite. Here’s the rise in nominal yields the last 2 months. And here’s the recent rise in 10-year real interest rates. Here’s a similar graphic from Alpine Macro showing…

Stagflation Nations: What, Where, Why, and How It Can Affect Your Investment Portfolio
First off What is Stagflation? Let’s define it. First the economic textbook and second the real consumer and investor world. Textbook econ definition: Stagflation is the combination of high inflation + slow, slowing, or worse, negative economic growth. Most of the time you have rising unemployment which can create a breakdown of the normal economic cycle where inflation and recession occur together. Real-world lens consumer & investors: Prices for essentials—food, energy, insurance—keep rising while wages, job opportunities, and wages vs costs lag, creating a squeeze on consumer spending power. Leading to a decline in real wages. Where Stagflation Is Showing Up Today (Top 3 Regions) Europe especially Germany, UK: Why? Well Europe spent decades outsourcing their energy independence to Russia and others in favor of more expensive and less reliable clean energy sources. Now Energy shocks from both Russia/Ukraine and Iran/Isreal are driving up energy costs and making their sources less reliable. Exactly when their higher regulation hurts both growth, weak industrial output, and lost market share to China. China: Property crisis and its outright deflation which is now in its 15th year continues to contribute to weak consumer demand. The deflationary pressures of many trading partners reshoring production combined with too many labor workers are mixing with the inflationary effects of higher energy and healthcare costs Emerging Markets think Turkey, Argentina): Chronic inflation caused by currency flight over decades continues to be paired with unstable growth and policy missteps. As for the United States here’s where we sit. Sticky product inflation caused by tariffs, reshoring manufacturing, and higher commodity imports costs. As far as growth, we are currently accelerating in GDP growth in the 2-3qtrs after a 1q26 slowdown. The AI capex spend has largely been the reason for the continued strength of the US economy vs. most other countries. However, given the weakening labor market on a $/job basis as well as the higher costs, the odds of a stagflation run here in the US are increasing for 2027. Why Stagflation Exists in These Regions: generally, 5 major…

1q26 Earnings Season and AI Capex Cycle Updated
Investors, combining our last few Stock Talks into one episode, leaves us here, It’s an Agentic AI Capex Boom Acceleration. So far, oil is up 50-75% since the Iran war began, and the markets shook it off. Interest rates are running higher on both higher inflation and higher growth with the 30-year treasury now over 5%. And yes, the S&P500 has shook it off so far. Both are headwinds not a roadblock. Why? Because S&P500 EPS are booming. Much like a previous capex cycle over 25 years ago. Yes, even earnings growth rates look familiar. to the 1997-2000 Dotcom capex run. But investors, even if we are reliving the past, there would still be room to run, because earnings matter more right now than the headwinds of higher oil and interest rates at these levels. With more companies reporting earnings, let’s update last week’s piece and go back to what really drives stock prices over time… EARNINGS and earnings growth rates. Not headlines. Not geopolitics. Not even the Federal Reserve most of the time. Once again, the data we are using is from FactSet Earnings Insight. They’ve updated their data and here’s the first chart on 12-month forward S&P500 EPS vs. the SP500 price. EARNINGS.Price follows earnings—and right now reported earnings are accelerating sharply. We are now two-thirds of the way through earnings season—and the data just changed meaningfully, in a good way. It just step functioned up higher. Meaningfully. 1st quarter EARNINGS SCORECARD so far? – BLOWOUT QUARTER As of this filming, about 63% of companies have reported, 84% beating earnings, 81% beating revenue. Earnings surprise +20.7% which is the highest level since 2021 when we were exiting Covid lockdowns and expanding on the massive fiscal and spending recovery. S&P 500 earnings growth now +27.1%. Here’s the historical YTY EPS growth rates for the last 3 years. Bottom line: This is not slow steady growth—this is a breakout earnings quarter. Where did the growth come from exactly? At the company level, the surprises reported by Alphabet, Amazon.com, and Meta…