

Breaking Down the S&P 500 Surge: Super Bulls and Swift Moves
Most of our clients and investment content viewers know that for our YouTube content, the OHFG investment team likes to stay away from general market reporting and generic comments, and provide value added insights into what we see going on behind the scenes. With the magnitude of earnings calls the last two weeks, this is one of those rare times I’m reverting to reporting. I thought the title “super Bulls move us Swiftly to S&P 500 = 5000 was appropriate given this is being penned on Super Bowl Sunday in front of the big game. Here’s a picture of the SP500 showing how far we’ve come the last 3 months from the lows in late October 2023 when many in the financial business were touting coming stock market crashes or economic recessions. Here is the daily chart: The OHFG was quite positive into the market lows in late October 2023, even going so far as “calling for the coming short-term bottom” the night of our Thursday October 26th Livestream with Troy, Charles, and myself. Back then the cash S&P 500 was between 4105 and 4150 and our team was forecasting a strong 4th quarter and 1st quarter rally that could take the S&P 500 to 5000 conservatively in the first quarter of 2024 and 5150 to 5150-5200 more aggressively in the 1h2024. Well, whether we are good at this investment management gig or just lucky, that’s what has transpired so far. Now, I must admit that I did not anticipate the directness of the move off the October lows. By directness, I mean the lack of almost any discernable pullback on a % basis or time basis so far. While we have messaged since the beginning of this move that we expected the rally to last about 5 months into mid to late March, as that amount of time is quite the normal initial run off a major low, I did not expect it to be so direct. Direct as in without almost any % pullback. We have now moved…

Why Even Bulls Need to Rest: Market Caution Ahead | S&P500=5000
While our OHFG investment team has been decidedly positive and bullish for over 15 months, with the S&P 500 already nearing our in-print forecast of 5000 for 1h24, I feel compelled to throw up a yellow caution flag here. Yes, the markets can continue to move higher throughout the first half of 2024. Our team has publicly discussed 5150 to 5200 on the cash S&P 500 not being out of the question. As discussed, numerous times the last 15 months, the markets, particularly the NASDAQ index, which is very heavily weighted to tech stocks, since the October 2022 lows, continue to follow the path of the great Dot.com internet run that spanned from October 1998 through late March 2000. While others have shouted for market crashes, we didn’t that as likely at all and saw the setup as very positive including into late October 2023 low on the S&P 500 near 4100. Which was so far, the last big buy as we have now rallied over 800 points. At this point, I believe caution is warranted over the short term. Bearish views, no? Caution, yes? Hence the title of this week’s episode, Even bulls need to rest, usually in February. Why? Let me step through a few of the reasons over the next couple of minutes. First an update of a few charts that most of my friends and business associates for over a year look at nod and move on from quickly. First the overlay of the Nasdaq composite index, which is largely the large cap tech stocks, since October 2022 through Feb 2nd and the October 1998 through March 2000 top during the early internet build out excitement. The overlay continues to be unbelievably tight. Even to having a short term trading buy on the Nasdaq for MOC on Wednesday January 31st as the NASDAQ also pulled back in late Jan 2000 into a short term buy. The S&P 500 overlay has diverged a bit in the last 2 weeks from early 2000 pattern and I’m pretty sure…
3 Stock Market Analysts to Pay Attention to When Navigating Investing and Sensationalist Forecasts
Many clients and prospects of OHFG have asked, “after watching your investment content for the last few years, Chris, you are quite up front that you don’t find much value in the vast majority of economists, politicians, strategists, and TV personalities “takes” on the economy and markets versus actually running investment savings for your clients. Whose research do you find valuable or insightful that we might want to look out for. This week’s episode is the “stock markets, technically speaking”. Coming largely from behemoth institutional money management backgrounds, we use to have access to pretty much every piece of sell-side research one could ask for including macro, micro, sector, single stock, and derivative research. Nowadays, selling market research is a billion-dollar industry in its own right. However, as a much smaller RIA, OHFG like most others are resource constrained so we can’t just subscribe to everything. However, I want to point investors to three resources that our team finds helpful for laying out probable forward moves in the markets. None of these resources appear weekly or daily on CNBC as a “CNBC contributor”, which is code for we are getting paid or paying CNBC. None are labelled “chart master” or the King of Bonds as a way to hype their opinions to others. All three of these strategists have been consistently right the last 5 years. They have been right or wrong, but flexible and quick enough to reverse course and be value added when they recognize their prior views were wrong. The first one is a market cycle historian, the second a combination cycle historian and technician, and the third, a straight up technician and one of the funniest personalities working in an otherwise dull and personality free industry. One of these providers is a one-time annual fee, one is research associated with a larger bank and brokerage firm that is free when you are a client of the bank and brokerage firm, and the third is an institutional strategist that we keep our eyes peeled on Linked in…

Why I Don’t Buy Latest Bearish Sentiment on S&P 500
Last week’s video, “2 things that really matter, revisited” must have struck a chord with investors. Why? Because I guess based on that video, I got a few inquiries about whether our 1h24 outlook (1h24=1st half 2024 for the viewer who asked) and S&P 500 forecast of 5000 was still what we were looking for. They took my tone and the content as negative vs. short term cautionary. This week’s video title? Chris S&P 500 = 5000? Why so bearish? The OHFG investment team likes to look behind the scenes at some more institutional type data, financial instruments, and trading series than many other financial advisors. With most of our team coming from larger institutional backgrounds, many of these factors lead markets and can be somewhat “predictive” of future moves more than most data series that are parroted by many on TV. But remember investors, nothing is ever both 100% accurate and precise. There is no “Perfect” in investing which is why one of the cardinal sins that most strategists will try to avoid is forecasting both time and price together. Last week we readdressed our thoughts on real time inflation, which is once again rising, regardless of what last week’s investor inflation sentiment survey said. Here’s the updated chart on 2-year, real time, inflation. The cautious tone, and that’s all it was was tone, I had during last week’s video, arises from the fact that inflation is seasonal and looks set rise throughout the rest of January into February on the back of many of the EXACT same reasons that goods inflation rose 18 months ago. And secondly, the level and trend in the “Real” interest rate component within nominal yields. This is also called the TIPs interest rate. This is the one that many market strategists finally discovered and started discussing as “critical”, almost universally in a negative manner, right at the market’s lows in late October 2023, right in front of the rip-roaring late 4th quarter rally. Remember all of those CNBC and Bloomberg interviews with strategists…
Inflation, Real Interest Rates, and Market Turbulence: What Investors Need to Know
On Friday, January 20th, 2023, with investor pessimism rampant, calls for a market retest of 3500 or lower throughout strategist land and S&P500 trading at 3900, I released a video titled “two things that really matter”. Here’s the link to that video. Our investment team had been talking positively about our expectations for 2023, but few people seemed to be listening. We had already published our 2023 outlook and a follow-on stock talk titled, “What could go right”? We gave a few reasons for our optimism during a time of uncertainty backing it up with historical statistics combined with real-time data series. I felt uneasy releasing this video and I’ve been doing this investment management gig for almost 30 years. As it turns out, our outlook for 2023 turned out pretty close to spot on in both price and time throughout the year including the summer selloff and calling for the 4th quarter lows and pivot higher almost to the day of our October 26th livestream. Here’s the link to that video with myself, Troy and Charles discussing the likely strength of the coming November through year end period. In this week’s video I’m returning to the EXACT same topic I addressed on Friday, January 20th a year ago. It’s title back then, What “really” matters. This week, the two things that matter, revisited. So, what really matters here? What two things above all else matter to investors? The same two things that most often do as far as I see it and they are intertwined of course. First, is inflation and both its level, whether it’s absolutely high or low, and sometimes more importantly, its trend. Is it rising or falling. From a high or low level? And secondly, the level and trend in the “Real” interest rate component within nominal yields. This is also called the TIPs interest rate. This is the one that many market strategists finally discovered and started discussing as “critical”, almost universally in a negative manner, right at the market’s lows in late October…
Stock Market News, Government BLS Jobs Data: Bullish or just B–LS–t?
We are hunkering down for upcoming 4th quarter 2023 earnings reports, so the investment team at OHFG is super busy. I’m keeping this week’s video short and sweet and I’m going to try to help investors and my subscribers regain something more valuable than money, what’s that? Your Time. Many retail investors I run into want to spend a lot of time with me discussing economic data and forecasts. Maybe it’s because I have been managing money for 30 years, or because I’ve taken all those econ and finance classes, or because I have a CFA, or maybe it’s because I went to a prestigious Ivy league school in Boston for my MBA, or maybe these investors themselves studied finance or econ in school. I don’t know, But what I do know, after doing this job for decades, that relying on, waiting for, or spending much time discussing and putting any weight on the weekly and monthly government data releases, outside of academic discourse, is a near complete waste of time for an investor. This week’s video, Government data, and more specifically Bureau of Labor Statistics, better known as the BLS Jobs data: Bullish or just B—LS—t?. Last Friday, with much fanfare from the White House as well as the politically biased news media, The Bureau of Labor Statistics (BLS) unit of the United States Department of Labor released it much anticipated by some, monthly jobs and unemployment rate reports. Here are a few of the promotional headlines by the press and the White House: The Hill: US added 216,000 jobs in December, blowing past expectations. CNBC: Payrolls increased by 216,000 in December, much better than expected. Reuters: Economy cranks out jobs at brisk clip in December. LA Times: Employers add a surprisingly strong 216,000 jobs in a sign of continued economic strength. White House: Touts U.S. Economy’s Strength as Election Year Begins If you were watching CNBC. Bberg news, or most other financial news outlets, you probably got an Initial rush of adrenaline listening to these stories. More jobs than expected? …

S&p500 2H2024…and beyond! Potential Paths, Comparisons, and Candid Cautions to Consider
While the OHFG investment team alluded to our 1h2024 outlook as far back as 4q2022 and released it in its entirety over 4 videos in late 2023, many clients and prospects always ask for more. They ask our thoughts on longer term time horizons that stretch out beyond 6 months, a year, or even multiple years. Investors, more often than not these types of long-term forecasts are a WOT, waste of time, as one’s accuracy decays exponentially with time. This is even though many strategists will try to fool their followers with guestimates of false precision. What do I mean? I mean these forecasts may turn out to be off based by hundreds in not thousands of S&P500 points, like many 2023 forecasts, but if I throw out extra digits, for example I’ve seem strategists carry their targets out to single digits and decimals, say the doomer for forecasts for 3125.5 for 2023, it reads as smart. For our OHFG 2023 outlook, I coined the term “The Old Normal”. Yes, I blatantly changed or plagiarized, take your pick, the overused “New Normal” phrase made famous by the always eloquent economist Mohamed El-Erian. Whether by our join knowledge and experience, hard-work, analysis, or pure luck, the OHFG 2023 market forecasts turned out to be nearly on point in both price and time for the entire 2023. To appease, those who keep asking, and with full disclosure that the OHFG investment team might change our outlook or collective minds at any time, I’m going to lay out visually what the second year, 2024, of the “Old Normal” might look like throughout the coming year. This is considering the three factors we presented in our 1h2024 outlook: volatility, economic growth, which is slowing, the 4th year of a Presidential cycle, as well as seasonality. For this video, I am using the cash S&P500 that close the year rounded to 4769, not the S&P500 futures markets that closed at 4820, the difference being about 1.07% which is attributable to the option premium of the…
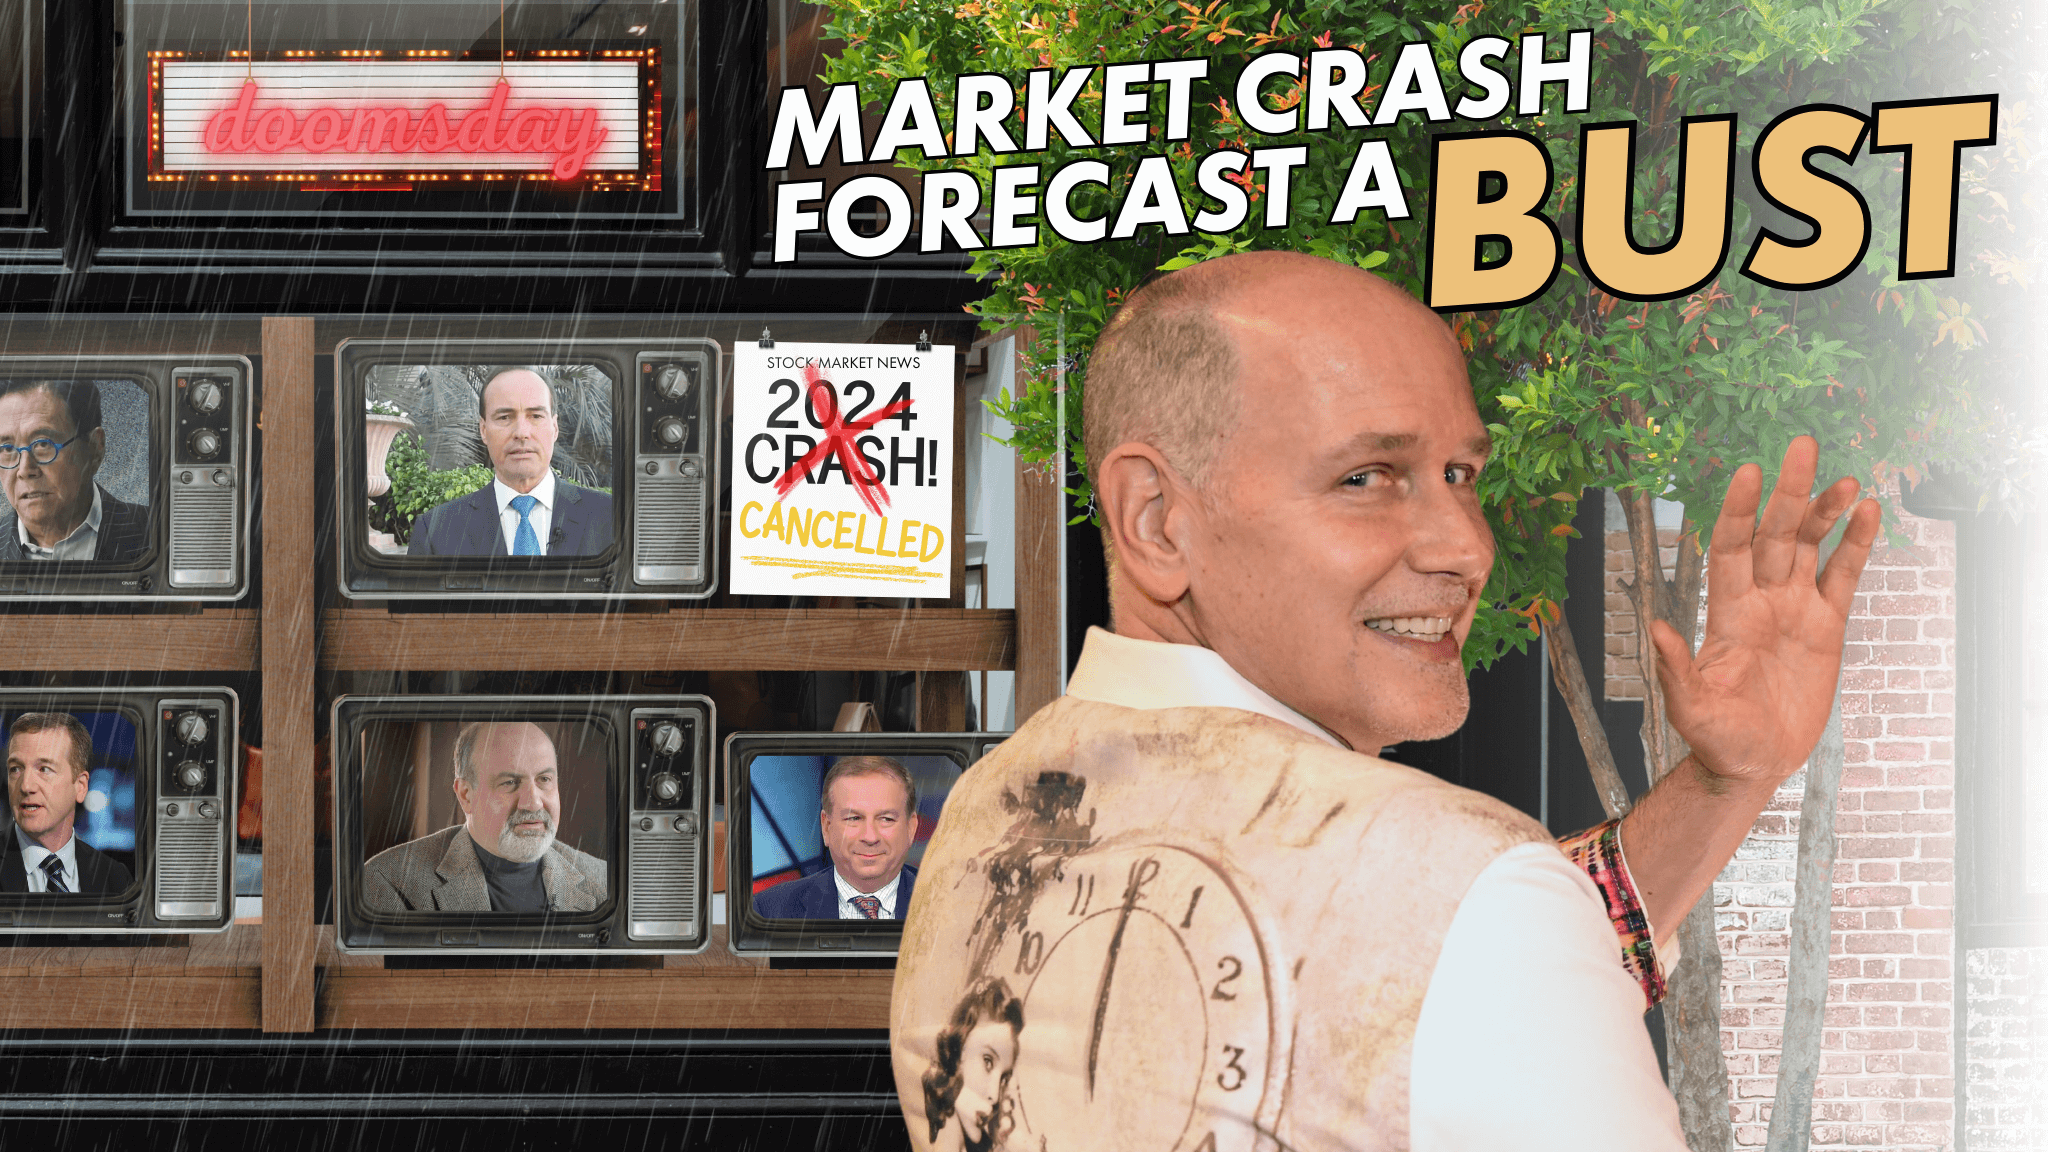
The Trouble with Harry, Dent, Robert, and Taleb-Fear Sells
Harry Dent has spent decades forecasting major market crashes, recessions, and economic downturns. While some of his concerns have occasionally aligned with market volatility, many of his most publicized predictions have either arrived years late or failed to materialize altogether. Rather than making investment decisions based solely on crash forecasts, investors are often better served by focusing on long-term financial planning, diversification, risk management, and retirement income strategies. Key Takeaways Harry Dent has made numerous high-profile market crash predictions over the past two decades. Several of his most dramatic forecasts failed to occur within the predicted timeframe. Fear-based market commentary often generates significant media attention. Market volatility is normal, but accurately timing crashes is extremely difficult. Investors should avoid making major portfolio decisions based solely on sensational predictions. A disciplined long-term strategy generally outperforms emotional reactions to market forecasts. The Trouble with Harry, Dent, Robert, and Taleb-Fear Sells Remember “The Trouble with Harry”? Hitchcock’s dark comedy, not a dead body in Vermont. This week’s episode tackles a different kind of trouble: Harry Dent’s fear-mongering predictions of the “Crash of a Lifetime” in 2024. For over 20 years, Dent’s been a fixture in financial media, peddling doomsday scenarios and claiming imminent market crashes. But how accurate has he been? Let’s dive into his track record and see if his latest prediction holds water. Dent’s misses: 1999: Predicted a roaring 2000s with a Dow at 35,000. Reality: Dow peaked at 12,000 and the decade was a bust. 2006: Touted “The Next Great Bubble Boom.” Investors enjoyed a short run before the 2008 financial crisis. 2009: Published “The Great Depression Ahead” after the market bottomed. Missed the subsequent bull run. 2017: Predicted Dow at 3000-5000 after Trump’s election. Dow currently 7-12x higher. 2021: Called a -45% crash by June, then doubled down with an -80% by Thanksgiving. Market hit new highs. 2022: Finally hit a single with a -35% downturn, but missed the year-end rally. 2023: Doubled down on recession and another “big wave down.” Bitcoin rallied 200%, S&P 500 up 20%. Why fear sells: Dent’s predictions might be shaky, but they’re lucrative. Fear grabs attention, drives clicks,…

Presidential Election Cycles and Other Factors Affecting S&P 500 in the First Half of 2024
Frequent OHFG investment content consumers know, I love data and I study history of the stock markets and economic cycles, largely because the markets are a real time view into behavioral finance and investor emotions. The 2024 market outlooks by strategists are out across the media outlets, and most of them read quite opposite of the negative herd that entered 2023. Many entered 2023 calling for recessions and or lower stock markets. From what I’ve seen, most strategists who missed the big rally in 2023 are now out talking much higher targets on the S&P. At least 5000 and some in the mid 5000’s already. The investment team at OHFG did not forecast a bad 2023 wayy back in Dec 2022. Many well know financial personalities called for investors to gorge on stocks at the 3000 .level or called for months for at least a retest of October 2022, 3500-3600 levels, as stocks rallied in the 1q2023! Of course, looking back, none of those events happened. No 3000. No retest. No October 1987 crash replay. Our second half outlook for 2023 had a year end target on the S&P 500 of between 4730-4800, near ATH’s. Pretty much where we stand. Not only that, we called for the summer selloff in advance of that downdraft and also called the near exact timing for the October lows as well. Our 2h23 outlook was released back in July and called for “down then up”. Here’s the link to that content. Troy, Charles and I did a YouTube livestream on Thursday Oct 26th, here’s the link to that video. Many market strategists who were absent or very late to the 2023 rally in stocks are now citing the “Presidential Election Cycle, year 4” as a big reason for their now bullish positions and much higher S&P 500 targets. Investors, I’m here to curb your enthusiasm for stocks here at year end, nearing all-time highs of 4730-4800, if your strategist is only now discussing this factor as a positive for stocks. 1h2024 Outlook Part 3:…

2024 Stock Market Outlook: Volatility, Goldilocks, and Presidential Cycles
Okay, investors, I had emergency retinal surgery last week, but I wanted to keep rolling out our 2024 market outlook because it is the end of the year. People keep asking, even though we’ve alluded to it for almost 12 months now. Last week we released the first part. It’s Goldilocks meets volatility 2024. We do have a price objective for the first half of 5000. That really hasn’t changed. We’ve talked about that for six to 12 months because we currently are following the path of 1999 through 2000, both from the Fed, from inflation, from interest rates, most everything we see going on. That’s continuing right now. Last week I was out, but I was following stocks for our clients and prospects. A lot of the moves we were seeing, whether it’s Bitcoin, whether it’s semiconductors, still mirroring the 1999 scenario, which that’s a good thing because that means the market can get near all-time highs here into the end of the year, as we suggested over the last six or 12 months. However, it doesn’t leave a lot of upside for 2024 in percentage terms. It would say that volatility is going to return pretty substantially in the first quarter of next year. That was our release last week for our first part. This week I wanted to cover the Goldilocks part that people talk about. If you turn on the financial news networks, you’ll hear strategists talking about it’s a Goldilocks economy, meaning it’s not too hot, not too cold. It’s just right, just like in the fairy tale. The thumbnail last week was an ode to that. Corinne, I want to give a shout out to, came up with a great clip with me over Goldilocks with some paddles to shock her because of the volatility we expect next year. What do economists and strategists mean by Goldilocks? If you followed me for the last couple of years, I don’t like nebulous terms. I like data. We’ve shown this in the past. The data says…