
Yen There, Done That – August 2007
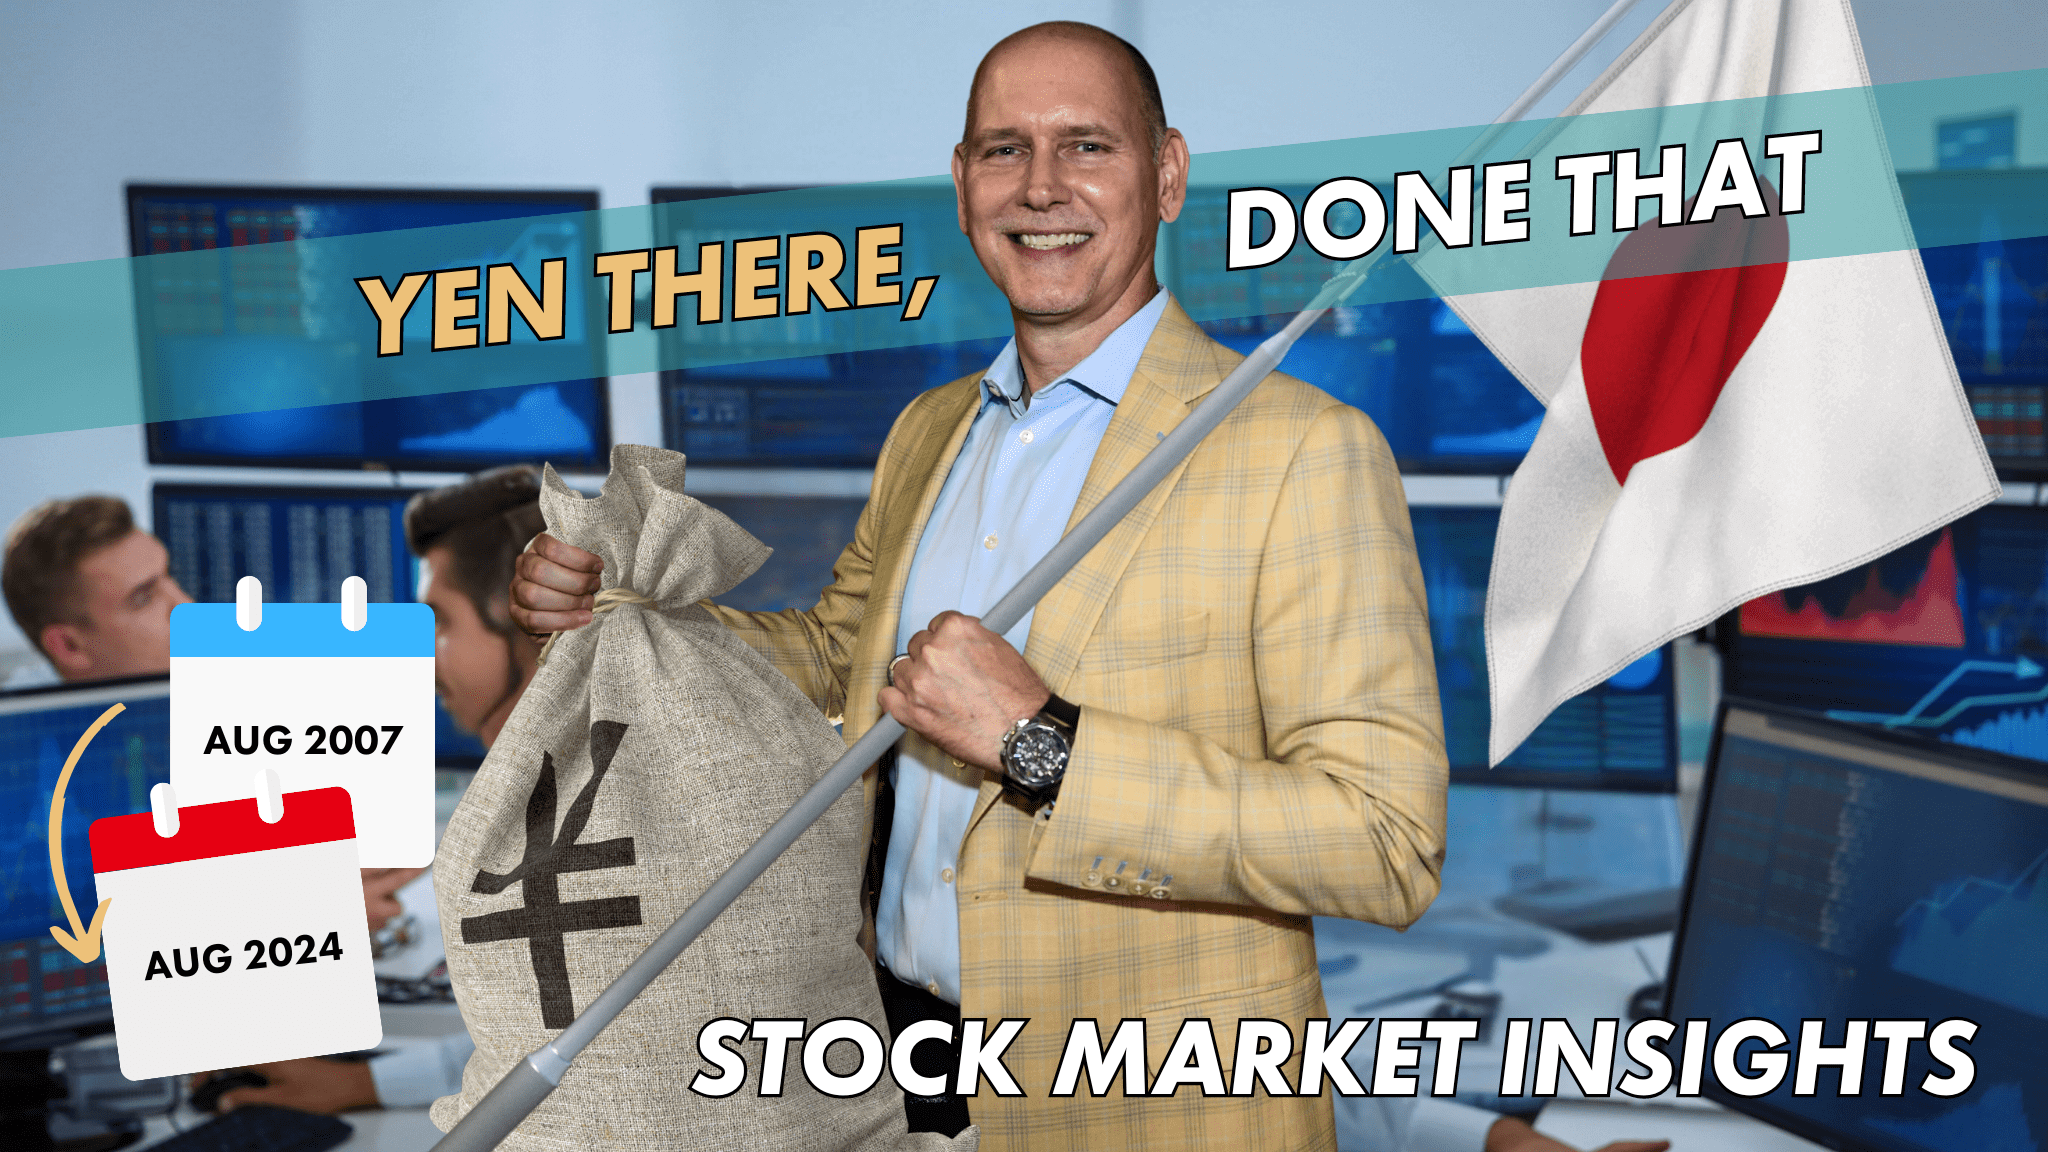
Global stock markets sold off violently 2 weeks ago and the SP500 cash index opened Monday August 5th down another -3%+ to take the index down -9.7% peak to trough over the last 3 weeks. That’s of course if you were a perfect seller and buyer. The current thumping started on Friday August 2 when markets in America dropped in response to the smaller number of new jobs created in July. The Japanese markets took a tumble on Monday, posting their biggest ever one-day drop in the Nikkei, Japanese equivalent of our S&P500. Since then, markets have moved up and down as investors attempt to understand what is going on. Later last week, the market rallying strongly and ending the week basically spot on flat for the week and -5.75% off its July 15th closing high. The cause? According to most financial networks, who were almost uniformly in the hysteria mode that global markets were “crashing” I nan unprecedented way, the blowing up and unwind of the Yen carry trade. In fact, some so called financial pundits, have attributed the “yen carry trade” as the “primary driver of global markets the last few years. Investors, this it utter nonsense in my few. Quickly reviewing what a carry trade is. Simplistically speaking, a carry trade” is when an investor borrows in a currency with low interest rates, such as the Japanese yen for the last decade+, and then that investor reinvests the proceeds in a currency with a higher rate of return, most recently the example has been Australia. Japanese Investors and hedge funds had been pyramiding this strategy in recent years, borrowing cheaply in Japan in yen, where interest rates are still low , about zero, and investing in place where rates are higher, such as the United States (5.25%-5.5%) or even higher like Mexico (10.75%). Researchers at UBS estimated that more than US$500 billion in US dollar-yen carry trades have taken place. When the trade begins to reverse course, for whatever reason be it interest rate differentials, monetary policy changes, or just…
Seasonality or More – Buy the Dip?
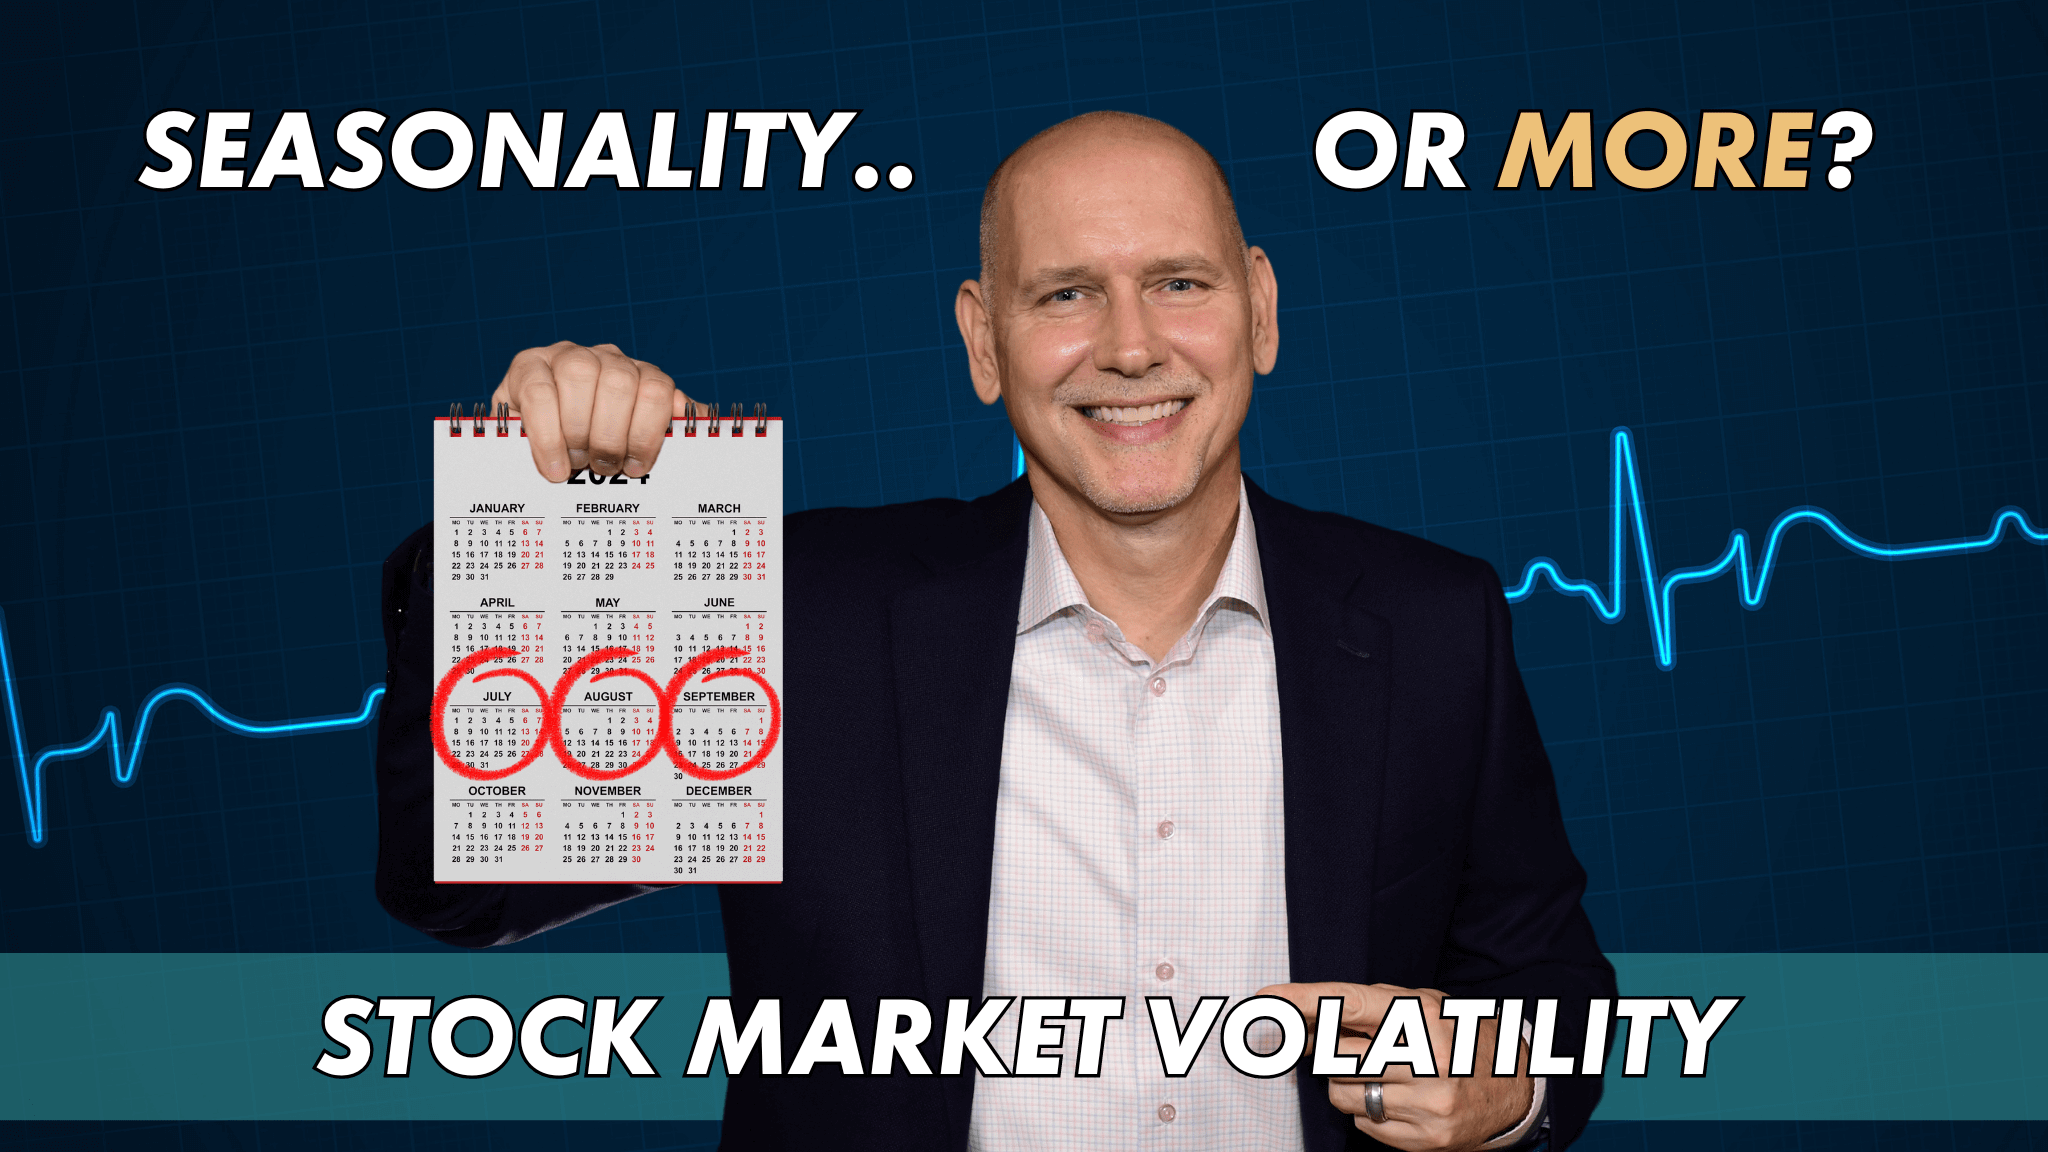
Global stock markets sold off violently last week, particularly on Friday. The technology-heavy Nasdaq 100 Index tumbled into a correction and the S&P 500 Index lost -3.2% in two days, its worst two-day stretch March 2023. Later cycle, or slower cycle, “Garp” stocks, “growth at a reasonable price, healthcare, utilities and real estate companies, which pay dividends and are popular with investors when bond yields sink, were by far the best performers in the S&P 500 for the week. Equity market losses were caused by a number of factors including 1- a “weaker” than expected US jobs report which showed continued slow job gains, with most gains from government sponsored programs and part time work and 2- the Bank of Japan discussing raising interest rates while other nations are lowering them, setting off a massive reversal of what is known as the Yen carrier trade. From its Mid-July peak the cash S&P 500 had fallen about -6.45% as of this writing on 8/4/24, from about 5666 to a low of around 5300. Why has this suddenly transpired, and volatility ramped higher? On the first point, the weak jobs data raised concerns that our Fed is “late” to recognizing a weakening US economy. The weakening US consumer was first discussed by our team way back in February after the last gasp XMAS spending spree. Concerns that the Fed will be late once again to recognize what is really going on and their “higher for longer” interest rate mantra, is just plain wrong. Real time real interest rates have been flashing the yellow warning flag for months. The warning that the Fed is actually “too tight, for too long” and the motto should be changed to “higher for wronger”. As for the second excuse, the Bank of Japan hawkish interest rate outlook and tighter monetary policy setting off a reversal of the Yen carry trade, that one is really being my pay grade. However, simplistically speaking, a carry trade” is when an investor borrows in a currency with low interest rates,…

What Could Go Wrong? It’s Deja Vu all Over Again
As an investment professional with over 30 years’ experience in public markets, actually managing other people’s money, actually, as they would say in our business “pulling the trigger”, that is not writing theoretical or academic papers and studies on the markets, or publishing a $99/month newsletter service, I seem to rarely get asked “what could go wrong”. The fact is it almost never happens when equity markets are at or near ATH’s and volatility is low as it has been ending the 1h24. Outside of Troy Sharpe our founder, I can probably count on my two hands the number of times I’ve been asked that question the last 6 years by an investment prospect, when the markets are up and to the right. That’s when investors brokerage accounts are at new highs. That’s when their “net worth” hits new highs. That’s when many people are marking to market their net worth to new highs almost on a daily basis. That’s when the emotional greed trade is hard to resist. I’m worth $2500, $25,000, or $250,000 more this month than last month. That’s a common mentality that I have seen kick in. As if anyone, In the investment world could go 100% to cash at the exact daily or weekly, or monthly top, pulling their entire stack of chips off the investment table and out of the equity markets. Those rose-colored glasses are hard to take off, and it’s really hard for many individuals to switch financial advisors while the markets are up and to the right. Why? Because they look at their accounts and think, I’m making money, why change horses? Even though as one nears retirement or is in retirement, maybe an investor doesn’t need to be riding a racehorse anymore or a thoroughbred. Maybe it’s the exact right time to look for a slower steady horse that can take on your goals, aspirations, and motivations for that next race? The slower race in retirement when incoming cash flow is less certain. Investors, I’m here to tell you that…
Why Boomers Love Doomers like Harry Dent, Robert Kiyosaki, and Robert Prechter
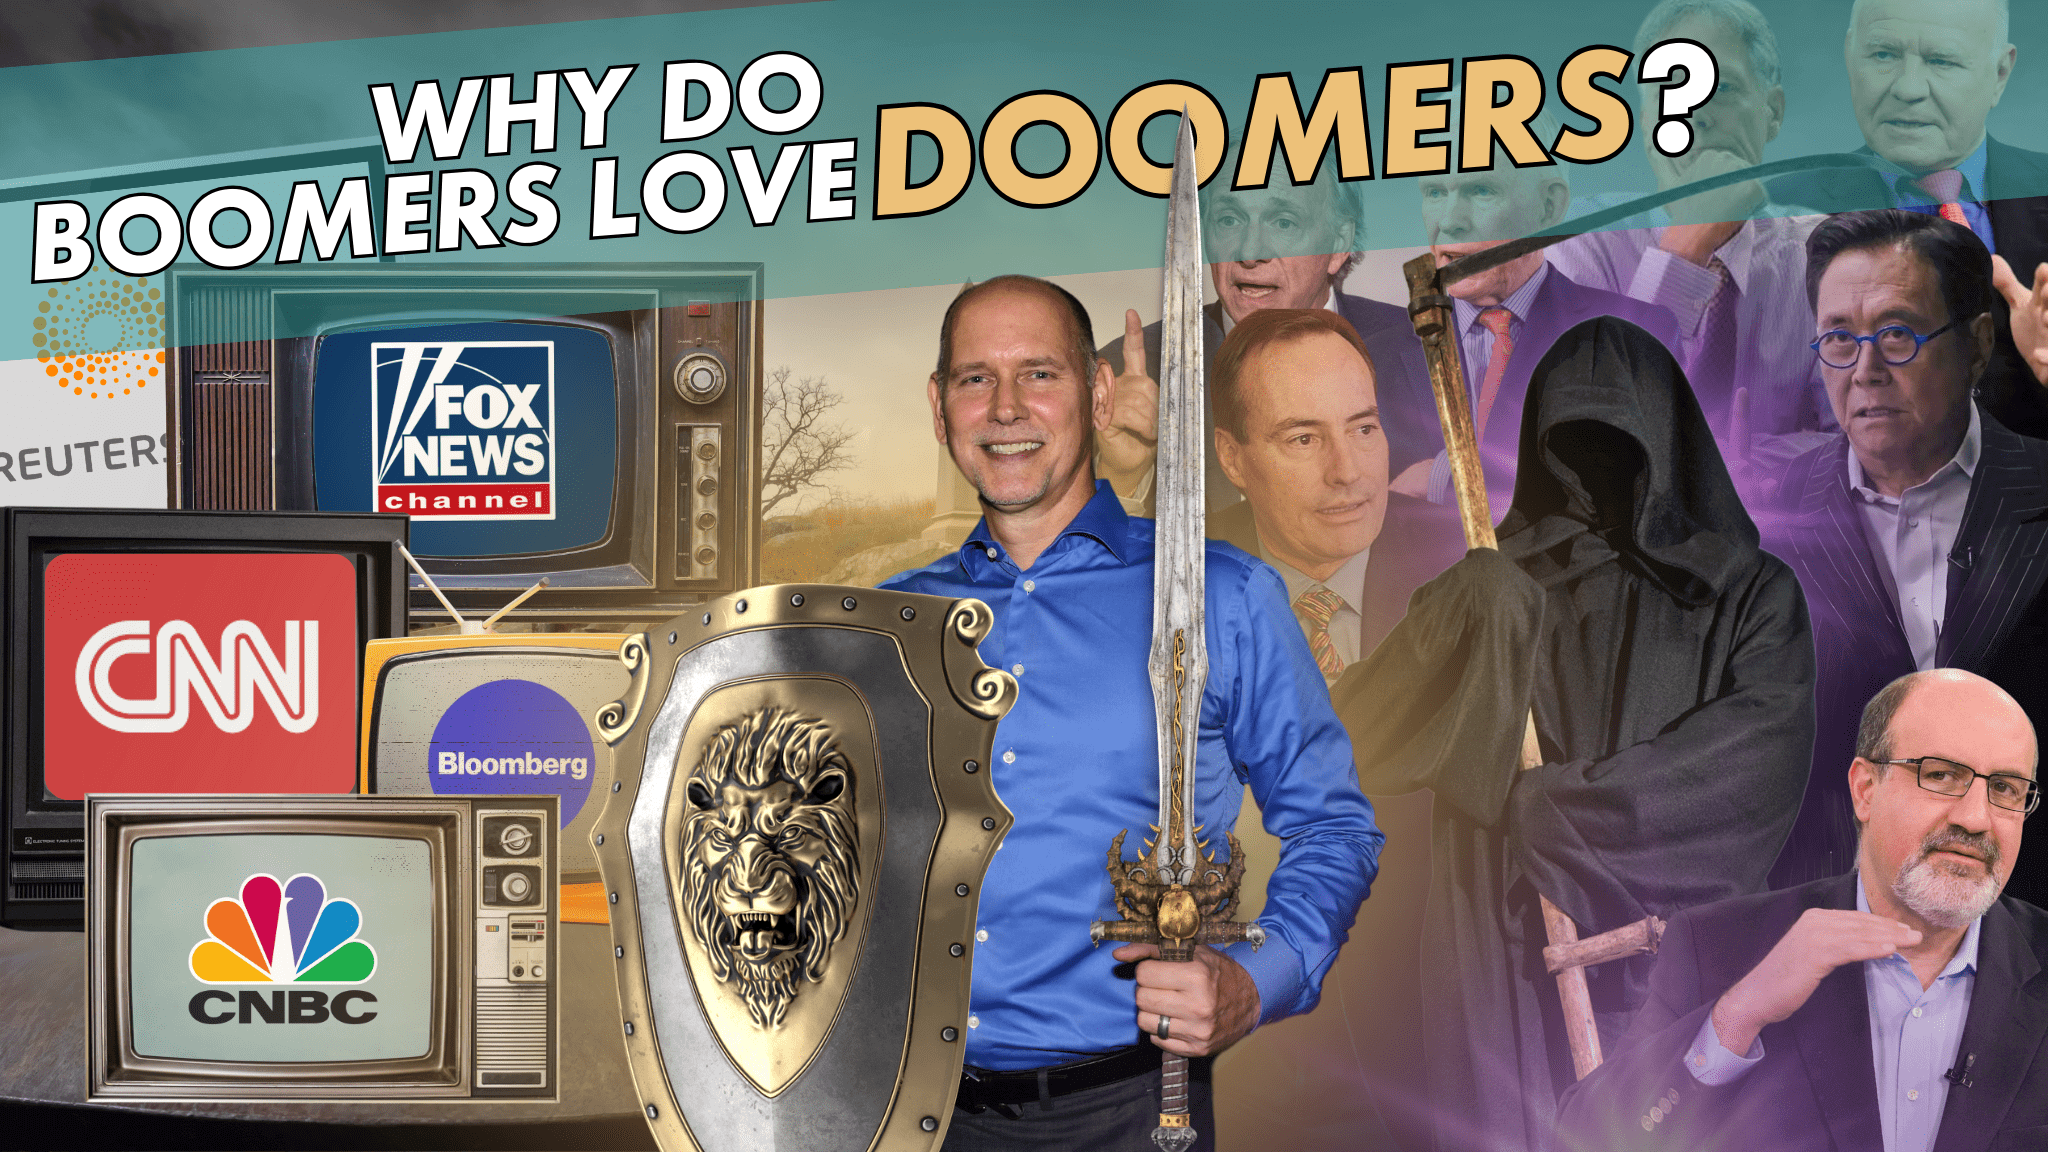
Harry Dent, demographic economist, and book and newsletter writer. Robert Kiyosaki, book writer, serial “entrepreneur, and seminar promoter. Robert Prechter, financial author and newsletter publisher. All have 4 things in common. 1. Successful self-promotion of their financial acumen, 2. Horrible long term track records of their predictive abilities, 3. To the best of my knowledge, none currently manages or have managed substantial amounts of money for others successfully in their careers, and 4th and foremost, they can be lumped into a category of financial sooth sayers I label as doomers. Doomerism actually now has a definition. It is defined as an extreme form of pessimism, or a predisposition to catastrophizing as a threat response. Call it “the End is always Near” way of thinking. Jeremy Grantham, co-founder of GMO Asset Management, Nassim Taleb, author of the Black Swan, the Impact of the Highly Improbable, and Ray Dalio, founder of Bridgewater Associate also have some things in common. They have actually founded or been advisors to highly successful investment management firms during some time period over the last 30 years. In Grantham’s case he now predicts a stock market crash almost annually. He was right twice earlier in his career, which is 2x more than most of these financial prophets, in a relatively timely fashion, so many investors in his age demographic still listen to him. In Nassim’s case, he is advisor to Mark Spitznagel Universa Investment founded after Talebs book was published. These three, while having run OPM during their careers, I also lump them into the category of “doomers”. Other notable Perma bears over the last few decades who continue to be promoted for their financial prowess by CNBC and other financial network, , Mark Faber of the Gloom, Boom and Doom Report, Gary Shilling, and “Dr. Doom, Nouriel Roubini.” However, while these 6 individuals have been quite visible and loud over the last 10 to 25 years depending on whom we are discussing, they have also been largely consistently wrong in their outlooks. Generally, wildly negative outlooks for the…

Russell 2000 – Rotation Nation or just Squeeze me Seymour, more Little Shop of Horrors’?
On the morning of Thursday July 11th, the government released its much-anticipated monthly CPI inflation report. It was lighter than economists expected thus given hope to 1 – earlier Federal Reserve rate cuts and 2- more rate cuts in 2024 and 2025.Recall that in his last few speeches, Federal Reserve Chair Jerome Powell indicated that the central bank was aware that holding rates high for too long could hurt the economy. You’ve got positive CPI on the back of a slightly dovish Powell,, and kaboom. When stocks opened, the S&P 500 gapped higher, but later sold off throughout the day and closed on its lows. While this happened, the long-maligned Russell 2000 gaped higher and strengthened even more on Friday. The variance between the 2 indexes was historically wide for the last 45 years. Yes 45 years! Even more extreme was the Nasdaq Composite, whose blistering YTD 2024 performance, led by large cap tech stocks, underperformed the Russell 2000 by more than 5 percentage points in what appears to be biggest daily gap on record. Here’s a daily chart of the Russell 2000. You can see the two huge up days a week ago. Friday July 12th is circled. The etf that best represents the Russell 2000 index is the IWM- iShares Russell 2000. In case you were curious over 30% of this ETF is sold short as a bet it declines or underperforms the S&P 500. That’s outrageously high for an ETF with over $65 billion with a B in AUM. Unless you were short with all those folks, almost everyone and I mean everyone got excited about this move and was out commenting on it. It was historic yes, and it was a great move up for those who have been waiting for small cap stocks to catch up, but was it the beginning of a major secular shift? Or just the start of possibly a 2–4-month bounce in small caps? No one can tell you for sure. Here’s a longer-term chart of the Russell 2000 index. …
Stock Market 1H24-“Everyones a winner?” Not
The 1h24 is almost in the books and most strategists will be releasing their recaps and 2h24 outlooks. I’m going to jump the gun and recap the 1h a little early. Why? Because about a week ago, I penned an internal email to the advisor group here at OHFG, outlining what has transpired YTD, and I got such good feedback I figured I would publish the info for all of our followers. Investors, I’ve been managing other people’s money in the public financial markets for upwards of 35 years now. I keep a running list of overused and misused or misunderstood phrases and terms used by the wider financial industry throughout media networks. One of the most over used phrases I hear on TV and elsewhere is, “it’s a stock pickers market” In fact, I can’t think of a period the last 20 years where this phrase was thrown around to start the year. Most of the time, the data says that that erm is nonsense. The markets rise, most sectors rise, with sectors of the 11 S&P 500 groups best the overall S&P500, and most stocks within the leading groups rise as well. Well, for the 1h24, much as was the case in 2023, outside of index investing in the S&P 500, investors, it has been a “stock pickers market year to date. As of Sunday June 23rd, The SP500, which recall is a market cap weighted index, is up around 15% total return, The tech heavy Nasdaq was up about 17% in price terms. The value tilted Dow Jones industrial index, which is price weighted, was up about 4% and the small cap Russell 2000 index was, flat, spot-on zeroish year to date. Here’s a summary of that data in table and graphically for those more visually inclined. However, with the S&P 500 up mid double digits, one might think everything out there has been working in 2024. That everyone’s a winner in 2024? https://www.youtube.com/watch?v=gHTcQB_4AFw Well, that would not be how 2024 is working investors. In fact, only…
2024 Summer Stock Markets: Where Things Get “Real”ly “Interest”ing
We are almost halfway through 2024, and I will admit, this has been one of the more interesting years I’ve seen during my career. While volatility at the S&P500 Index level remains near historically low bounds, ex 2007, single stock volatility is uch higher than I can recall. You have large cap tech stocks like Adobe trading up 15% on a day or up and down +/-15% in the case of Dell within a 2-to-3-month period. The S&P 500 continues to follow the Presidential election cycle almost to a T, but below the index level lies a chasm in the dispersion between the two sectors outperforming the S&P 500 year to date, technology and communication services and the other 9 sectors lagging the S&P 500 year to date. J.C Parets of All-star charts puts this in perspective. As of last Friday, June 14th, The S&P 500 and the Nasdaq 100 both hit new all-time highs. However, fresh 6-week lows the Advance-Decline line of the broader NYSE index hit new 6-week lows. Oddly enough the Advance-Decline line of the Nasdaq 100 also hit new 6-week lows. That’s what market technicians call “bad or deteriorating breadth”. And viewers, while bad breadth it is not a great timing tool, it is a condition that warrants monitoring as it means below the surface, there are creaks and fissures in the markets. Remember that the S&P 500 is a market cap weighted index, so larger market cap stocks like Apple and Microsoft carry a much higher weight and influence than stocks 50 through 500, Here is a dispersion chart of the equal weighted S&P 500 by sector for the last 15 weeks, about 4 months. Look closely at this for a second. You will probably be shocked to see the data. This chart shows the best overall performing sector the last 15 weeks on a breadth basis, which doesn’t adjust for market cap weight, is not technology or telecommunication services but rather, the usually boring utilities sector. I think few investors see this, and even…
Summer Loving – Tactical Trading
Once or twice a year I find myself penning a script to a video, combating the almost constant dire economic and stock market bubble warnings from the likes of Harry Dent, Rober Kiyosaki, retired hedge fund billionaires, and for the last 15 years and counting, Jeremy Grantham. Most of these calls actually come from individuals or services that 1- do not actually manage money, 2- never have managed money, and worst of all 3- know absolutely nothing about you, your family, and your individual financial situation. My latest video on this topic was released early in the year to combat the annual crash cart callers that are out en mass at the beginning of the year to generate book and newsletter sales I think. To date, it is our most viewed investment video on YouTube. Here is the link to that video. https://www.youtube.com/watch?v=PPUrkEUQKGE One of the interesting things about it, is its had over 6000 views on YouTube in barely 6 months. This far surpasses our video releases during the 2h October last year when the market was declining, and we were previewing our teams forecast for a strong 4q23-1h24. It is also almost 3x the viewership we have had for our livestream event Thursday Oct 26th, near the weekend of the market lows last late October 2023, where our team both accurately and precisely called for the rally in stocks to begin. No guarantees of a repeat, but certainly interesting data points. https://www.youtube.com/watch?v=yR4A1XTBO54 With these things in mind, I wanted to talk about tactical trading and asset allocation rebalancing. Why? Because It’s summer and we are in the normal summer rally time for the stock markets. Believe it or not, overall stock and bond volatility is quite low at the index level. If you are nervous about the future, this is when you should be talking to your advisor. You should not wait until volatility is trending higher or spiking, it’s usually too late to add value to your portfolio then. Our team tries to give data in advance…
Stock Market: Are We Heading for a 70s-Style Crisis in 2025? What’s Going On?
High inflation? Wars in the middle east and Russia and Ukraine? Protests on college campuses into school year ends in May? There are quite a few stock strategists and economists who have made many valid comparisons to the early 70’s and what has been going on the last few years globally and in the US.in politics, socio-economically, and some even in the stock markets. While I do have an MBA, I’ve taken all the economics and finance classes you can think of, and I have managed money for other people for almost 30 years now, my historic studies of the economy and the financial markets, whether it be stock, bonds, or commodities. Tell me, that it is NOT currently a 70’s repeat here in the US and financial markets, however, there is a slight chance of a similar negative outcome in 2025 and on in stocks if Central Banks around the world error in their ways over the coming 6-9 months. This is going to be a short episode of stock talk and hopefully it will go as smoothly as the hit early 70’s Marvin Gaye song, “What’s Going on”. https://www.youtube.com/watch?v=H-kA3UtBj4M The lingering question for stock markets, investors, traders, asset allocators, sector rotators and our economy is? What does “Higher for longer” mean? And with the Fed still holding to that script, while other central banks start cutting rates, will the Fed break something in the economy and the financial markets before they break inflations back in their own eyes? Frequent viewers know I look to the bond market for clues and cues to what’s going on in the markets now, and what might be going on in the future because of it. Our team doesn’t just look at nominal interest rates, which are the ones you see quoted on TV, your brokerage account, or by most discussing financial markets. Our team looks at the two components of Treasury yields. Those two once again are 1. Inflation expectations and 2. Real interest rates. Inflation, as we all know, erodes the…
2024: A Year of Storms and Volatility?
Ok, Stock Talk with Chris was down but not out for the week of May 24th. Why? Well Oak Harvest’s little town of Houston, here in Texas, suffered a brief, less than an hour long, but terribly disruptive Spring Thunderstorm that rolled straight down 290, through Memorial, the Heights, the Montrose, and the downtown financial area in Houston. We had 70 to 100 MPH straight line winds and almost 1 million Houstonians were without power for a day, 750k without power for 2-4 days, and almost 75k still a week after the storm rolled through town on Thursday May 16th right during rush hour. Our A+ operations team, led by Chris Ayers, piloted Oak Harvest through the logistics of the power outage and got our team back and running at full strength as quickly as possible. TY Chris and the rest of your team. So that storm and the outbreak of storms throughout the Midwest causing deadly tornados, and the rest of our country this year got me thinking about the topic. It got me thinking is 2024 going to go down in history as the year of storms. And I’m not talking just the weather. Whether the storms are weather related, sun or solar flare related, politically related here or overseas, war related in Ukraine and the Middle East, or financial market related? Is 2024 destined to be the year of storms? Clearly the first 5 months of the year have started off on rocky footing in the areas of weather, politics, and military conflicts. Maybe its just the energy in the universe of peak solar cycle #25 that gave us those beautiful auroras as far south as Texas after the May sun eruptions, but something seems a bit diff in 2024. I don’t know what it is. However, with all the turmoil in those areas, the one area that most media commentators continue to predict rampant volatility for 2024, but has really not presented itself year to date in an abnormal way is? Yeap, the financial markets….