

Investing in Value Stocks? or Value Traps?
We have all done it as investors, even the great Warren Buffett has done it. In fact, Mr. Buffett bought the a whole airline sector a few years ago. What is the “it” I speak of? The it, is buying a stock based on valuation or on it being a “cheap” buy, only to be massively disappointed by its stock returns going forward. The subject of this week’s podcast? Is that a value stock? Or a value trap? I am Chris Perras with Oak Harvest Financial Group here in Houston and welcome to our weekly stock talk podcast. Before we get into this week’s topic on value traps, please take a moment to click on the subscribe button and click on the notification bell so you will be alerted when our team uploads new content. First off, almost everyone has a different definition of what a “value stock” is. Let’s come to an agreement for this video that it’s a stock that is cheaply priced versus its own history or versus the overall market on a price to earnings, or P/E basis, price to cash flow, or price to book value basis. Most of the time, “value stocks” trade at low multiples of earnings, cash flow, or book value because they have little promise of future growth; they have no ability to innovate, or they cannot control costs. However, I argue that value traps can occur even in companies that appear healthy and are growing. Even if a company has been successful, having experienced rising revenue, profits, and share price for years, it can fall into a situation where it is a value trap in one’s portfolio. There are all sorts of criteria that one can look at to minimize the number of value traps stagnating or hurting your portfolio returns. However, the number one factor that I have found is a company’s marginal ROIC. What’s ROIC stand for? It stands for return on invested capital. And what should an investor look for? They should see if the incremental cash…
Will There Be A Second Quarter Rally? Stock Talk Podcast
As I write this, the tax season is behind us, and we are into earnings season. It’s a Friday, and we look to be in the midst of some margin calls and forced selling in the market. This looks to be caused by collateral damage being done in the Treasury bond market as the market peaked Thursday morning almost to the minute as Fed Chairman Powell, was interviewed, and paid tribute to previous Fed Chairman, Paul Volker’s actions, in the 1970s to stop high inflation. The market proceeded to drop almost in a straight lone from 4510 to 4275 or almost 5.25% in less than 2 trading days. The stock buyback window for equities is almost entirely closed right now. This contributed to the heavy selloff, as companies are not in the market bidding for their own stocks on weakness. However, buybacks should build in the coming weeks in May and June after companies report earnings. The S&P500 sits at 4275ish. Overall, if you turn on the news, one gets the impression that the overall stock market should not be where it is. Many suggest it should probably be materially lower already, despite overall earnings estimates rising for the S&P500. We wanted to provide a little data dispelling that notion. Additionally, we want to add a little data of optimism for the remainder of the second quarter with the important disclosure that our team still expects, overall, the markets to remain choppy and sloppy and very messy through the third quarter of the year. We’ve detailed why numerous times since early November of last year. Check out our previous YouTube videos if you are interested in more of that detail. I am Chris Perras with Oak Harvest Financial in Houston and welcome to our weekly stock talk podcast. Before we get into this week’s topic titled, “Late 2nd Quarter rally? That’s the norm”, please take a moment to click on the subscribe button and click on the notification bell so you will be alerted when our team uploads new content. …
1st Quarter Review | Stock Talk Podcast
First-quarter 2022 is now behind us, and I can say with absolute certainty, it was the sloppy, choppy mess that we first previewed in early November of last year. During the first quarter, the S&P500 declined short term, intra quarter, into “correction territory of more than -10%, reaching down about -12.5% from its cash closing high to cash closing low on March 8th. The Nasdaq composite, which is largely high-growth technology and healthcare stocks, fell just short of “bear market territory” intra-quarter to -19.5%. I am Chris Perras with Oak Harvest Financial in Houston, and welcome to our weekly stock talk podcast. Before we get into this week’s topic, which is a review of the 1st quarter markets, please take a moment to click on the subscribe button and click on the notification bell so you will be alerted when our team uploads new content. As I previously mentioned, the overall S&P500 sustained its first intra-quarter correction, universally defined as a decline of -10-20% in price, since our Covid lows in late March 2020. The NASDAQ composite index fell within a whisker of its own “bear market,” defined as a greater than -20% loss using market close prices. That’s the bad news. The good news is that had you not panicked at the worst time, on or near the lows which is also when most investors anxiety is highest, and had you stayed pat in your overall indexes or strategies that you designed with your financial advisor you probably didn’t blow up your long-term financial plan. Why? Because those two indexes, the S&P500 and Nasdaq composite, then violently rallied almost in a straight line into the quarter-end. The final tally on the S&P500 was down about -5% in total return. The NASDAQ composite first-quarter decline amounted to about -10%. And with that, the first quarter, sloppy, choppy mess was over, only to move into the second quarter for what likely will be another 4 to 6 months of messy overall action led by large and violent sector rotations. Here is…

The Markets Are Up…No, The Markets Are Down…No…Now What? | Stock Talk Podcast
On Friday, March 11th, during the 1st quarter correction that took the cash S&P500 down -13%, from its closing high to cash closing low, if you were perfect, that our investment team had foreshadowed back in early November of 2021, we put out our Friday podcast titled “things that lead- early optimism, signs of bottoms, lows and pivots. Then the next Monday, The S&P500 closed the day at around 4170, and the bears came out of the woodwork, declaring the end of the world due to the S&P500 forming a “death cross” technical pattern. We did a podcast a few days later on that topic, debunking that “myth” with the real data sets and facts. Since the March 14th, Monday closing low in the SP500 of 4170, the overall index proceeded to rally almost 11% in less than three weeks, ending the volatile first quarter on a high note. Short-term Measures of volatility, like the spot vix, collapsed along the way from close to 35 to under 20. I digress for a moment to tell you that it’s funny that I got only one call from a client and prospect the last four weeks asking about why the markets were rocketing higher in a volatile fashion. You see, viewers, we have selective bias in the markets like we do in most things human. Most of us tend to complain about high volatility when the markets drop, but we are seemingly ok and dismissive of “volatility” so long as the screen is green? Viewers, they are both markets of volatility. Volatility is a measurement of change, not direction. We just like that the direction of positive volatility changes our portfolio to green. I imagine the question now is what’s next for the second quarter. Have we gotten through a turbulent first quarter as you said we would months ago? Are we off to the races, you might ask? Unfortunately, my answer there is that’s highly unlikely. The so-called crystal ball says that overall, there should be another two…
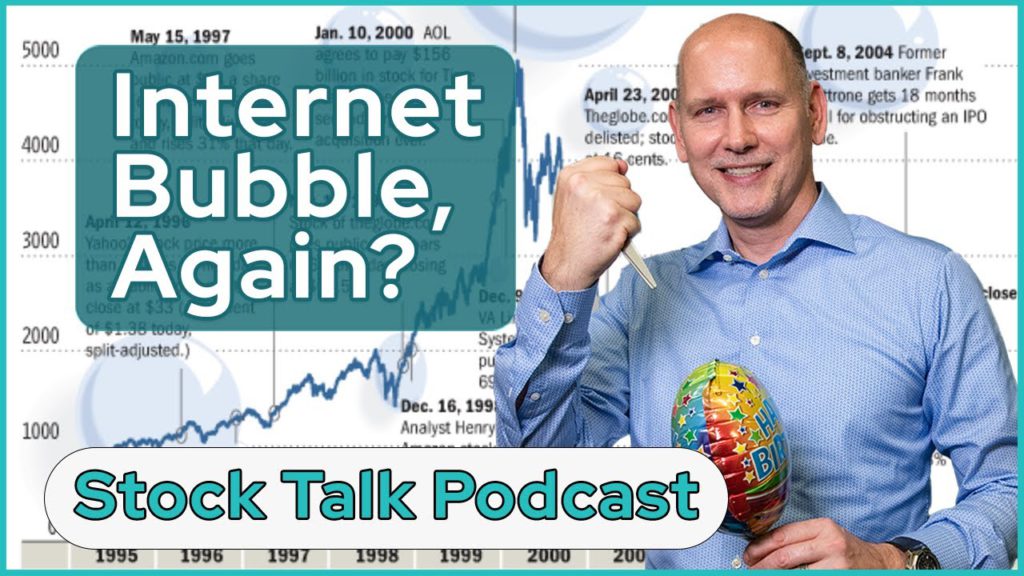
Are We In A Replay of the 1990’s Internet Bubble? | Stock Talk Podcast
Chris Perras: Viewers I get it, everyone wants to call a top, everyone wants to gain a reputation and earn some street credibility. What better way for someone to gain fame and bring in assets or maybe it’s to sell more newsletter subscriptions, what better way than to call for a major market top well in advance? I get it. Careers can be made by getting one negative call right or even close to right. The credibility of being a one-hit or two-hit wonder can be tremendous. Look no further than legendary investor Jeremy Grantham of GMO who granted, was correct and early to call the Japanese stock market bubble but is being quoted still 12 years into the current secular bull market saying since 2010 the market was overvalued and a bubble was going to burst. If you followed his advice you’ve missed out on roughly 15% compounded stock returns for the last 12 years. He’s got credibility with the TV press because he did call the bubble top early and correctly on Japanese equities 30 plus years ago. Yes, he will eventually be right and we’ll have another lost decade in equities. All of you have lost the last 12 years following his [unintelligible 00:01:15] advice was 12 years loss of substantial positive returns. Viewers, I’m Chris Perras, Chief Investment Officer at Oak Harvest Financial Group. Back on Friday, March 11th, with the S&P 500 trading at roughly 4,185 and many on TV calling for new lows in the S&P 500, and others redefining the term bear market, our investment team released a podcast titled Early Optimism: Three Signs of Bottoms, Lows, and Pivots. As a quick refresher, these three signs we covered were, one, investor sentiment being overly negative, two, market breadth, or the number of green stocks markedly outweighing the number of red stocks on your screen. Third and finally, forward volatility markets in the Term Structure of Vol. Since that day, the cash S&P has rallied almost 8% in a straight line over only…
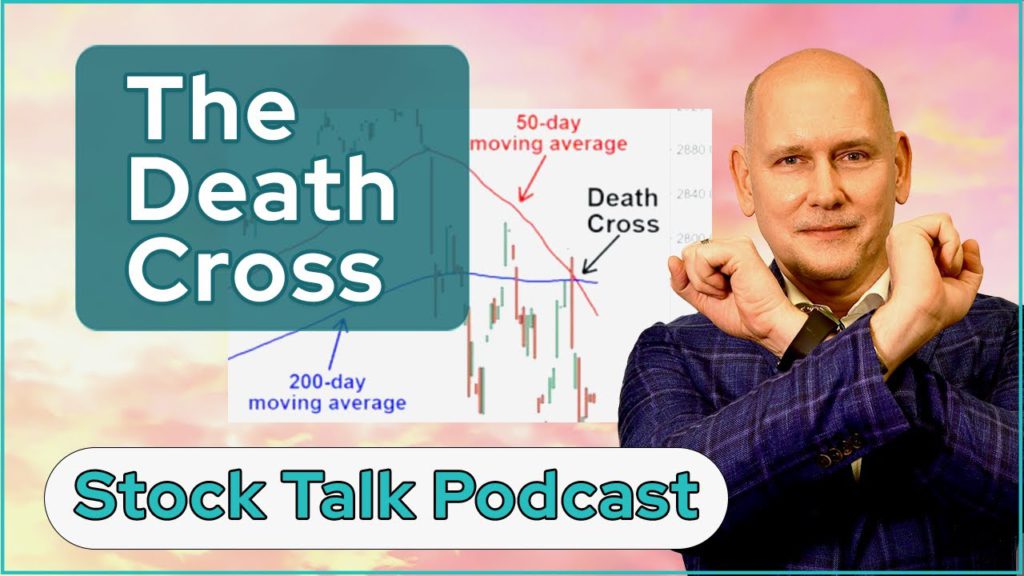
Income Planning Nightmare? The Deathcross Stock Talk Podcast
On March 14th, the S&P 500 triggered what technicians refer to as a “death cross” pattern. This pattern has historically been viewed as a bearish technical signal with such an ominous-sounding name. What is the “death cross”? Well, its signal is generated by a crossing in the S&P500 price of the 50- day moving average below its 200-day moving average. On March 14th, 2022, the S&P 500 generated its 49th Death Cross since 1928, according to research done by Merrill Lynch. The prior Friday, on March 11th, with the S&P 500 trading around 3185 intraday, the OHFG investment team released our weekly podcast entitled “Early optimism, Things that lead, three indicators that are starting to lean positive for equities for the upcoming months. Viewers might be asking what in the world is going on? Whom and what data should I believe? I am Chris Perras, Chief Investment Officer at Oak Harvest Financial Group. Today, we’ll cover the topic of “death crosses,” what they are, how frequent they happen, and if they have been historically relevant and good predictors of the future to your portfolio over time. If you count late November as the top given when divergences began, we are in our third or possibly the fourth month of this downturn. Viewers, this is a correction in both price and time. Listen to me; It’s not a dip. With this correction continuing to play out over months and likely quarters, many long-time, or always bears, have come out of their caves with their negative ammunition. They have gotten large and loud in their pronouncements on TV, much as they have for the last 10-12 years. The question to investors is, should their concerns over this “death cross” technical pattern worry investors? Is the “death cross,” historically the “deathnill” for the markets? Recall viewers, no data series is perfect, no batter or investor bats 1.000. However, according to data from Merrill and many others, returns after a death cross have been lackluster but not as bad as the name of…
Things That Lead – Early Optimism: Signs of Bottoms, Lows, and Pivots | Stock Talk
In late October of last year in the first few of our first YouTube videos within Oak Harvests investment series, I covered 4 of the real time data series that we follow that were early warning signs of rallies and then followed it up with a video on 2 data series that are early warning signs of market tops and corrections. Here’s the link to that content it if you are interested. https://www.youtube.com/watch?v=u1rc5FwNb8k I am Chris Perras, Chief Investment Officer at Oak Harvest Financial Group. The markets are in correction territory. We did forecast this back in 4th quarter of 2021 saying we expected a -10-12% correction in the first quarter of 2022. Recall viewers definitionally a correction is defined as -10+ in the SP500. Well, if you were perfect at selling the cash closing high and buying everything back at the cash closing low on February 23rd you avoided -11.85%. Is this fun? No, not one bit. It would be particularly bad if you were leveraged. Something we do not do at Oak Harvest. However, now many on TV are calling out many of the early warning indicators as bearish. Things like the flattening yield curve and the higher bond volatility, move index which supports collateral and leverage we spoke of back in 4q2021 are now becoming commonplace on TV. Given we are in our third or possibly fourth month of this downturn, if you count late November as the top given when divergences began, I wanted to update our viewers on where a few indicators now stand. Why? Because there are a few that are beginning to turn try to inflect positively. Call this episode, early optimism signs. Despite still being in a very messy time period that our team has been foreshadowing for months, and which we expect to continue for months, I want to bring a little optimism to what might be many equity investors, otherwise gloomy outlook. Three data series that have historically led bottoms, lows, and pivots up…

Conflicted Markets and High Volatility, Bring the Few True Buy and Mold Opportunities for Equities
Russia’s invasion of Ukraine last week has pushed the S&P500 beyond the correction line of -10% and into the -12% range from its November levels of 4700. Early last November, was when we first discussed much higher volatility for the first half of 2022 and the likelihood of first correction in the markets since March of 2022 in Mid-4th quarter of last year. If you were perfect selling the early January top in the SP500, you avoided – 13.5%. If you did so and have a documented history of repeating this market timing feat consistently, give us a call, the investment group at Oak Harvest is looking to hire! I am Chris Perras, Chief Investment Officer at Oak Harvest Financial Group, and we are in the midst of the sloppy, choppy, messy, time period our team has been foreshadowing for months, however! I want to bring a little optimism to what might be many investors, otherwise gloomy outlook. Let’s call this episode “conflicted markets” and high volatility, bring the few true buy and mold opportunities for equities. Why? Because as a retail investor. Time is on your side. First, off, viewers, let me be clear, I am not one bit dismissive of the horrible events transpiring in Eastern Europe, Ukraine, and Russia. My prayers go out to families on both sides of the border who have been brought into this event by the powers to be beyond their control. Viewers, this discussion will be focused on what it might mean for your money and the markets. So, here’s some data on military conflicts and their outcomes on the overall stock markets. The first set of data and charts were published by Tom Lee’s group at FundStrat. Historically, the last 5 “invasion” conflicts from the Vietnam War through the Crimean Crisis, on all 5 occasions, the overall stock markets rallied on the invasion. Viewers, please recall your history books. World War 2 was the beginning not ending of a multidecade bull market. I’m not saying this is World War 3, however…