Weekend Update, November 4th, 2024
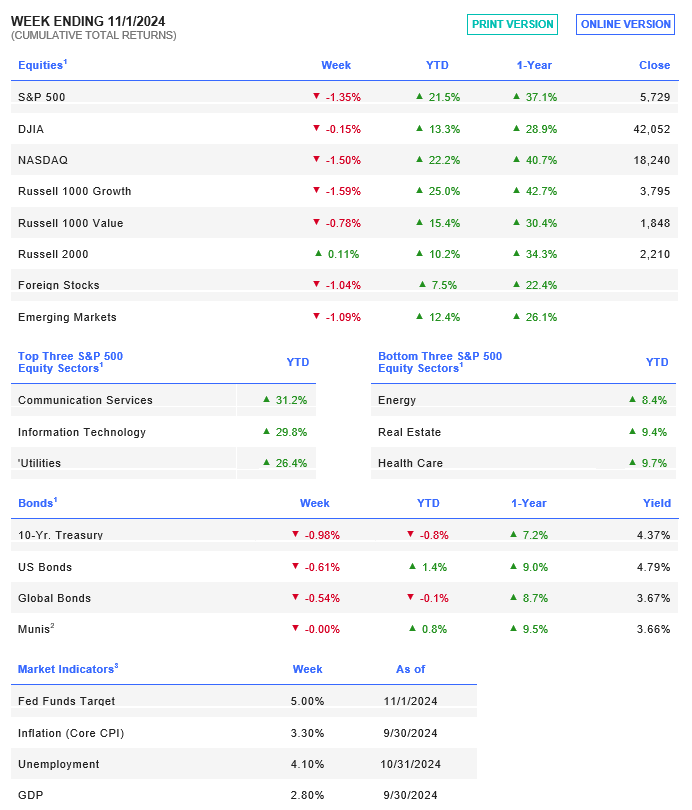
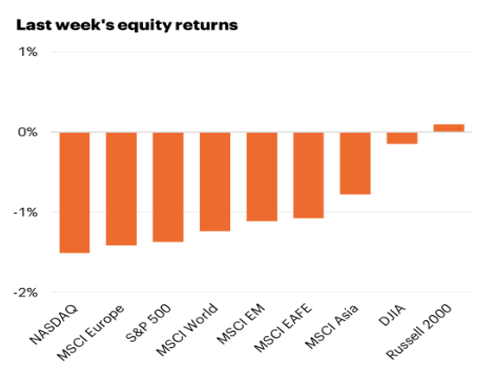
Index, Sector & Asset Performance
Tomorrow’s Presidential election will take center stage for many investors, particularly those with short trading time frames. Given recent economic data, expect the Fed to cut rates by another 25 bps later in the week.
US stocks closed lower for the 2nd week on disappointing labor market data. The S&P 500 ended the week down –1.35%, as tech earnings worsened investor sentiment. Overall, the S&P 500 dropped -1% in October, dropping its YTD gain back under +20% for 2024 at +19.6%. This was the first monthly decline since April.
Interest rates rose to three-month highs for the week in anticipation of Friday’s jobs report. The initial reaction to job gains was a decline in short yields, but bonds then sold off and the 10-year yield ended at 4.38%. Yields are lower this morning on a rethink of economic strength.
Source: FS Insights
Economic Indicators and Earnings Commentary
The jobs data was horrific last week even adjusting for hurricanes and the Boeing strike. Job openings for September were well below consensus expectations at 7.443M. Job creation in October slowed to its weakest level since 2020, with nonfarm payrolls increasing only +12k, below consensus expectations for 100k. The unemployment rate printed in line with consensus expectations, holding steady at 4.1% for October. The adjusted jobs data is covered here and shows the economy struggling below the headlines outside of DC.
Initial jobless claims fell to 216k, lowest in half a year.
The two key drivers of consumer spending growth, income growth and household wealth, have been strong ytd.
Large cap tech earnings broadly disappointed, led by Microsoft dropping over -6 % after announcing a weaker forecast for cloud revenue growth. Google showed AI investments paying off and initially jumped on the report but has since fallen back to pre-earnings levels. Apple’s report was good, but its forward commentary caused skeptics.
Global Market Trends/Commodities/Currencies
Crude prices fell at the beginning of the week on continued soft demand out of China. Oil ended the week at $69.50/bbl after Iran threatened to escalate tensions with Israel.
In the Gold markets, the price of an ounce is around $2750 per ounce.
OHFG Exclusive Data & Charts: Historical Pre and Post Presidential Election market moves. Countdown is On.
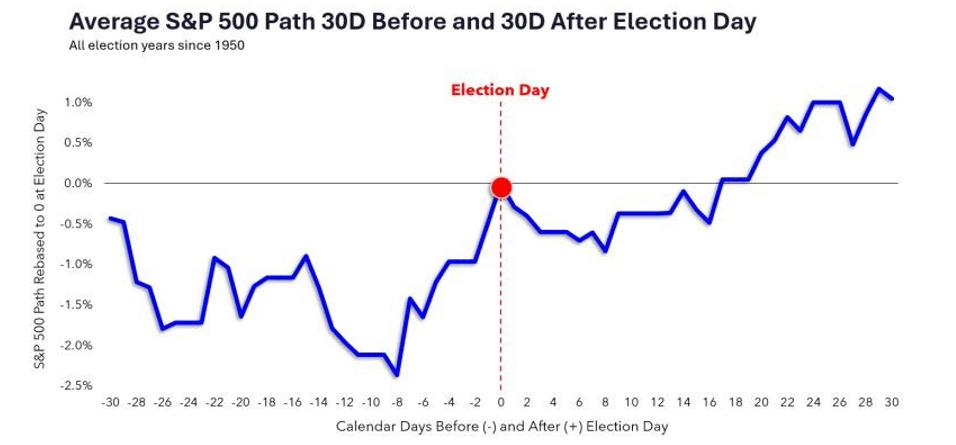
Source: Charlie Belio
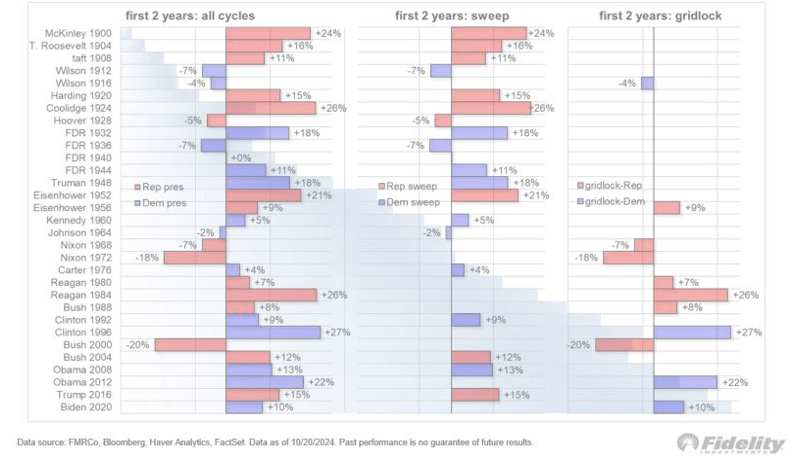
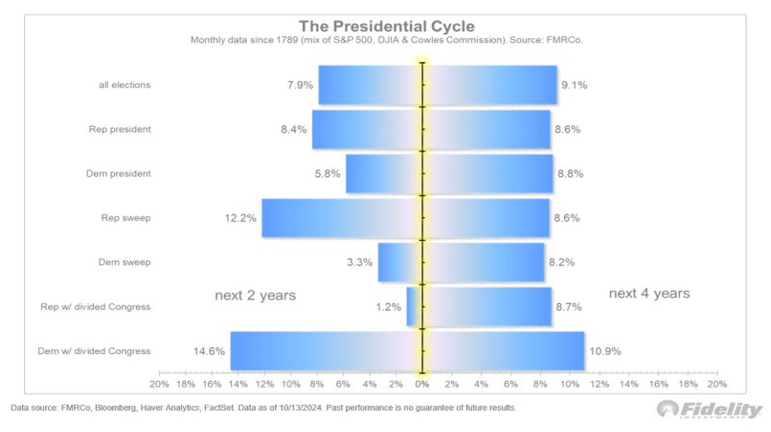
Other Historic Election Data and Presidential Cycle Data from Fidelity:
Contrary to most thinking, historically, sweeps have not been disasters for the markets. GOP sweeps have been slightly more favorable than DNC ones. Over 4-year Presidency’s, the best average annual returns have actually come under a DNC President and a GOP controlled Senate. Here’s the 4-year annual return data as compiled by Fidelity:
Oak Harvest Weekly Stock Talk: Will 2024 Echo 2016? What a Trump Win could Mean for Stocks and Economy