
Investment Management
Second Half 2020 Market Outlook
"Election Worries Breed Investment Opportunities"
Recap: How We Got Here
At the end of the 1st half of 2020, the S&P 500 stood at 3050. This was up 3.7% year over year, down -5.5% year to date and down -10.1% from the February 19th all-time high in the S&P 500. What happened in the first half? Well the path to 3050 on the S&P 500 was not quite the one we laid out back in late December 2019 in our first half 2020 outlook. Neither Oak Harvest, nor any other investment advisor, foresaw the one thing that mattered after late February. Of course, that one thing was the out-of-left field Covid-19 virus global pandemic. The chaos caused by the pandemic resulted in the fastest and deepest decline both in global economic growth, and global stock markets ever. The S&P 500 peaked at 3392 on February 19th and reached a low of 2192 on March 23rd.
In late December of 2019, when we penned our first half outlook entitled Stay long and Carry On, we forecast a strong rally in early first quarter 2020:
From where we sit near 3200 on the SP500, the team at OHFG sees an additional 5% upside in the first half of 2020, call it 3300-3400, call it 3350 on the S&P 500.
From a price perspective, we see the S&P500 returns being front end loaded in the first half of 2020 and reaching 3350 midways through the first quarter of the year. 3350 on the S&P500 is roughly a 5% return from current levels. Another 2% upside is possible, to roughly 3400 through the first half of the 2020. However, if we should reach that level early in the year, the team at Oak Harvest would view this move as “too far too fast” (TFTF for short).
Early 2020 should see a continuation in the ‘it’s time to play offense’ theme the investment team at OHFG first laid out back in mid-August of 2019. By playing offense, we mean that being overweight in asset classes such as small capitalization stocks, international, and emerging market stocks, and overweight sectors like technology, consumer discretionary, industrial, and financial stocks are the places to be more heavily invested. Safer, low and no growth, and less volatile sectors such as utilities and staples should continue to lag on a relative basis.
The S&P500 proceeded to peak at 3393 on February 19th, 2020, within 7 points of our max upside target.
We went on to argue that the pace of market gains would likely slow come mid-first quarter of 2020, due to the confluence of three factors: 1.) the slowing of the Fed balance sheet expansion, 2.) normal market seasonality, and 3.) tax policy concerns related to the upcoming presidential election tax policy concerns. Observing the landscape in the middle of the 1st quarter, we remained confident in this view.
However, the COVID-19 pandemic dramatically and suddenly changed the landscape of both global economic growth and monetary policy.
On March 23rd, Oak Harvest released a YouTube video market update, and spoke about the healing signs we were seeing in both the bond and credit markets, even as we saw the highest levels of volatility in the markets in the last 15 years. We followed that up on March 24th with a special edition of our Stock Talk Podcast called released Early Hopeful Signs and again on April 6th with a piece entitled, Trying to Thaw.
In these releases, we discussed the signs that historically proceeded “V-bottoms” in both stocks and the economy. We were optimistic, while many in the financial media were calling for “The Great Depressions Round Two” or for replays of the 1918 Spanish flu. We went so far as to discuss early pent-up demand in housing and auto sales we were already seeing.
The S&P 500, in turn, went on to rapidly regain much of the ground it had lost year-to-date through early June, while the Nasdaq actually reached a new all-time high on June 4th.
The 4 S’s
So, with all that said, what is in store for the second half 2020? Will it be more of the same? We first released our early thoughts on June 19th in a weekly podcast entitled, Second Half Surge: The Bulls Run Wild with 4 S’s. The 4 S’s frame our view of the second half of the year and are: Stimulus, Science, Sentiment, and Seasonality.
Stimulus
The first “S”, “Stimulus” is a combination of historic Federal Reserve monetary policy and likely additional fiscal stimulus out of Washington DC for the remainder of 2020 in order to combat the virus. This will likely be followed up by increased federal spending in 2021 to bring home jobs from overseas, particularly from China, and through additional, much needed, infrastructure spending. The accompanying chart of the Federal Reserve balance sheet versus the S&P 500 shows the strong direct correlation between Fed monetary support and the S&P 500 over the last 8 years.
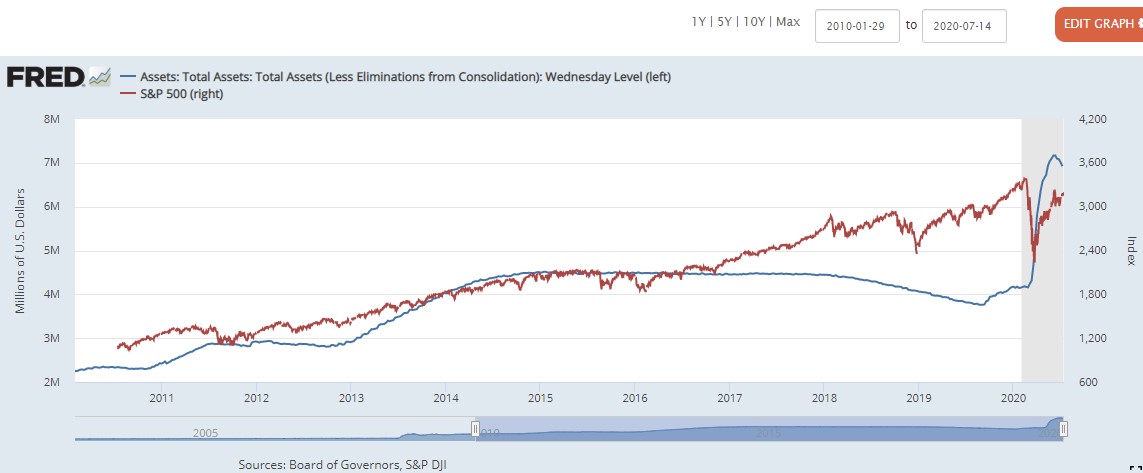
Fed monetary support
Science
The second “S” for the back half of 2020 and 1st half of 2021 is “Science.” By science, we refer to the collective efforts of hundreds and thousands of science and healthcare professionals to find an antiviral or vaccine for Covid-19 in record time. Each week brings new knowledge and discovery of what the virus is, how it works, how it is spread, and how to slow it and cure it.
Whether its recent news from Johnson and Johnson and the smaller Moderna on vaccines in stage three trials already, or the development of anti-virals by the likes of Regeneron and others, science is moving at breakneck speed on a pretty unified front to solve this problem. Every day brings us closer to a solution, and seemingly every day that we hear positive news on the science front, the S&P500 jumps 1-1.5%. And this is before a definitive solution has been realized. We believe a strong positive outcome is far from factored into stocks.
Sentiment
The third “S” is Sentiment. What is “sentiment” in the stock markets? It is a combination of investor psychology and reality. It is a combination of investors’ past positioning in stocks (how long they are or are not), of what people have done with their money the past few months (bought more stocks or raised cash), where they currently are positioned (how happy they are with their current allocation), and where they plan to go with their money over the coming months and years (how interested are they in buying or selling stocks). Let’s take a look at sentiment in 2020.
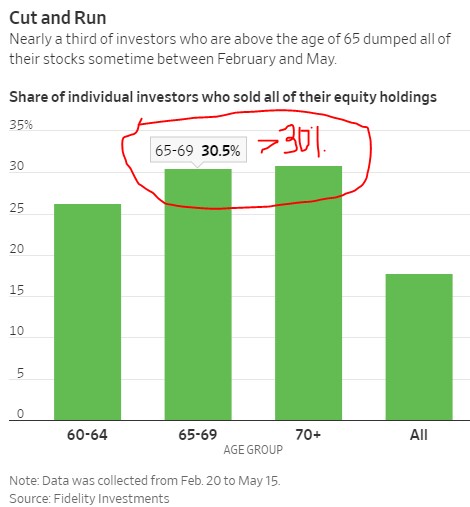
First off, what happened to sentiment in the virus induced downturn? What did investors do with their money? Data from Fidelity Investments, who monitors almost $7 trillion in total assets and touches over 32 million clients, shows that 30% of Baby boomers went 100% to cash on the way down, or near the bottom in the late first quarter decline. Yes, 30% of people over the age of 60 sold all their equity holdings. Not only did they sell stocks, but according to Fidelity, they have not yet bought back their positions. With the equity markets nearing their all-time highs, we believe it is an emotional, tricky, and painful decision for these investors to “get back in.”
While Baby Boomers were selling, what were Millennial investors doing? The Millennials were opening new accounts at record pace. Generally speaking, investors do not open new accounts to sell stocks and bet on market declines. The average investor opens a new account because he or she is optimistic about the economy, the future, and stocks, and they want to invest and put their money to work. Millennial investors were buying stocks as Baby Boomers were dumping.
Why were Millennials buying stocks? Some TV hosts surmised that it was either gambling or for entertainment, which may have an element of truth to it. However, our research indicates the primary reason was that, as a recently penned editorial on CNBC argued, Millennials saw their generational chance to buy equities and didn’t want to miss out. There could be other factors in play. Millennials may believe in the US economy and stock markets, regardless of who will be running the nation in 2021.
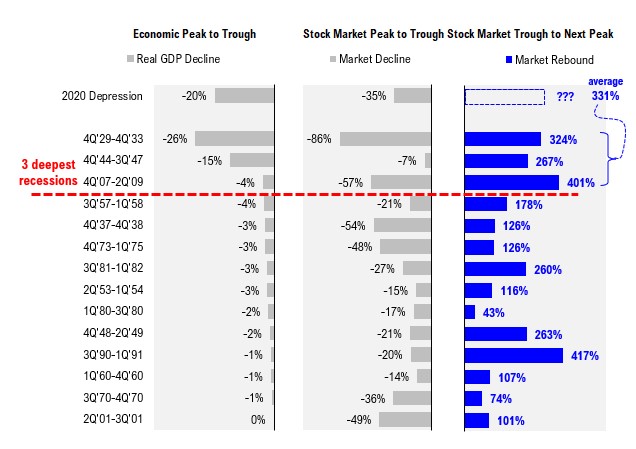
Further, according to research firm FundStrat, if one looks at the 3 worst economic contractions since 1900, the average post-contraction equity rally resulted in a 331% gain! Yes, following the 3 worst recessions America has experienced the past 120 years, the average combined return during the next economic expansion was over 325%.
Seasonality
This brings us to our final “S,” which is Seasonality. Per Fidelity, since 1945, the S&P 500 has gained almost 2% as the cumulative 6-month average for May through October, on a price-return basis. Compare that figure to a 6.7% average gain for the November through April period. Moreover, the S&P 500 has generated positive returns about 65% of the time from May through October, and positive returns 77% of the time from November through April. This outperformance is consistent across market caps and regions. Arguing for a strong second half 2020 and early 2021 in the markets is consistent with historical economic growth and stock market returns.
An Election Year
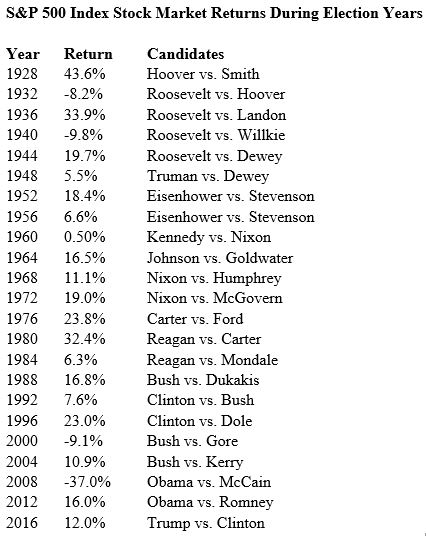
There is an additional element to our “Seasonality” argument: 2020 is a presidential election year. Almost everyone likes to talk about politics and their effect on stock markets. The media certainly expends copious amounts of energy shouting about it. However, while the election is obviously of great importance for the country and we will certainly be watching what happens very carefully, for the stock market and stock market returns, historically it actually has not mattered who has ends up winning. Historically, election years have been good years for stocks.
According to a 2019 Dimensional Fund Advisors research report, the market has been positive overall in 19 of the last 23 Presidential election years from 1928–2016, only showing negative returns four times. It hasn’t mattered whether the winner has been a Republican or Democrat, the stock market has had positive returns over 80% of the time.
Typically, the time to pay close attention to the outcome of elections has been the August before the election, and again late in the first quarter following an election year. The August prior to the election matters because stocks generally move in advance of outcomes. The market will be pricing in its expectations as to the winner before the election actually happens, and this usually begins appearing around August.
The 1st Quarter after the election matters because any policy changes that an election winner may seek to implement only start becoming reality months and quarters after the election is over. Not-so-coincidentally, this tends to coincide with the typically summer economic slow down, just when people start coming out and saying, “Sell in May and Go Away.”
The Oak Harvest View
So all this data and information leads us to the key question: What do we expect to happen in the 2nd half of 2020?
Our view is that the most likely scenario for the second half of 2020 is that the market approaches or regains its all-time highs, between 3300 and 3400. Technology stocks are already there on the back of much lower long-term rates caused by the virus slowdown.
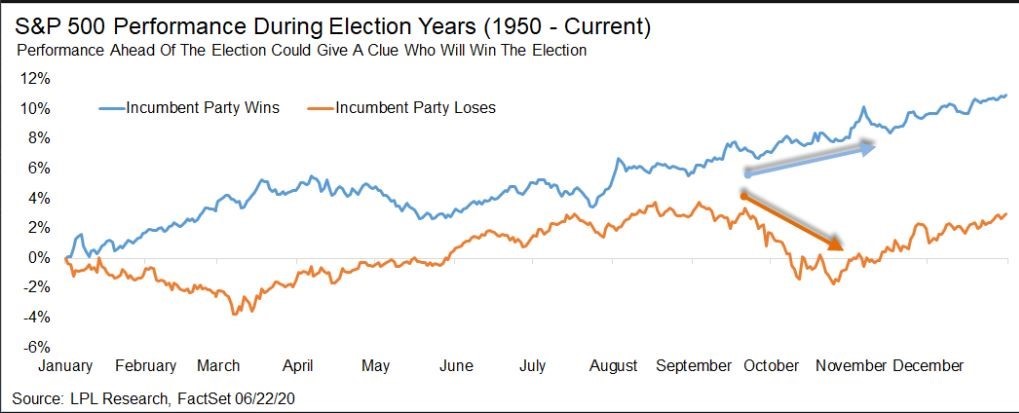
The markets will most likely spend August through early October consolidating gains and pulling back during its normally slow period. As of today, the second half path is likely to mirror that of both the normal seasonal cycle in stocks and the path portrayed by the previously mentioned election year cycle chart.
The S&P 500 could once again retest its 200-day moving average. Right now, the 200-day moving average on the S&P 500 sits around 3025. Fast-forward a few months and that moving average should be upward sloping and approaching 3075-3100+. This is all normal.
Even in “V-bottom” patterns, in most years, this is what happens in late summer due to economic growth slowing. This year its even more likely to show this normal slow-down as domestic growth concerns over the Corona Virus are likely to continue.
Should the economy continue to regain its footing throughout the summer and 3rd quarter, the odds of an incumbent win by President Trump are likely to increase substantially. In this scenario, the S&P 500 is likely to continue its relatively linear upward move throughout the summer and into year end, due to lower volatility and the prospects for continued low tax rates over the next 4 years at least. The normal “incumbent win” returns would target the S&P 500 at about 3550 near year end.
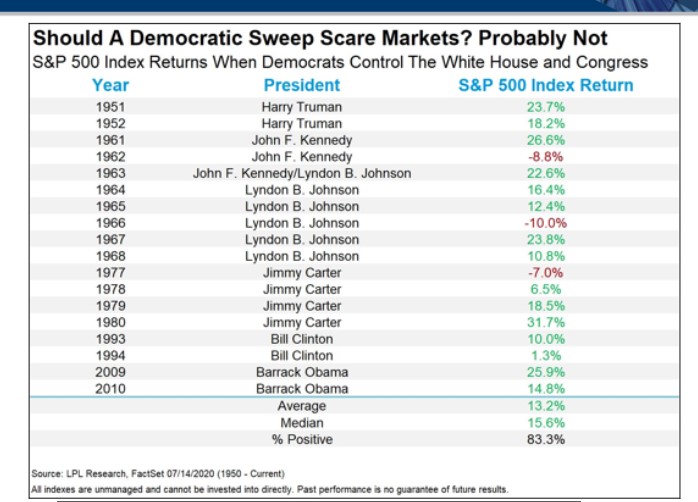
On the other hand, should we fear a democratic “Blue Wave” in the upcoming elections if the result goes the other way? History would say no. History would say, “stay calm and carry on” and stick with your financial plan. Regardless of election outcomes, history says that companies in the stock market can find a way through different sorts of administrations, and can generate strong positive returns even under a more challenging regulatory and tax environment.
S&P 500 Targets and Conclusion
Setting targets on the S&P 500 is always an uncertain business, and we will point out again that a particular forecast for the broader market is not what’s really important for investors. What will impact you the most is your particular portfolio, your strategy, and your financial plan. With that said, here goes:
As of the time of publication, we are going to call for a year-end price resulting from a little below the average return in an election year. Our view is that the S&P’s ending price for 2020 will be largely independent of who wins in November, with only the path and volatility involved for the S&P 500 differing, based on the eventual winner.
Typical election year returns put the ending S&P 500 level at 3450 to 3500.
On the high side of 3500, that’s up about 14.5% from mid-year and another 7% from the current 3250 level. The math behind the stock market, hidden in option pricing, says that 3700+ on the S&P 500 is likely in the first quarter of 2021.
If, post-election, the markets can regain their Federal Reserve induced calm, it may even be possible to see a blow-off top of 4000+ in the first half of 2021, as the economy accelerates based on job and wage growth, earnings, and capital investment returns.
Our view right now is that the level the markets ultimately reach over the next 6-12 months has not changed much over the last 6 months. This is because investors currently have a powerful and key ally: Federal Reserve Chairman Jerome Powell.
If we fall short of these higher S&P 500 levels, it will not be the fault of central bankers. The Fed has set forth very accommodative policy, and shows no indication that it will be adjusting that stance any time soon. TV news anchors like to say stock markets like certainty, but as the first six months of 2020 has shown, there is no certainty in life!
What markets and investors really crave is consistency in policy. Not to say that investors and company management don’t prefer some policies or regimes over others – they do. Managers will certainly find it easier to thrive in some monetary, regulatory and tax environments than others. However, though investors may not like some rules and regulations, such as higher tax rates or more regulation, or some side-effects of tariffs, history has shown time and time again that management teams and companies can adapt and maximize investor returns so long as the policies under which they conduct business are not moving targets.
For reference, in July of 2016, just a few months in front of the 2016 presidential election, in almost the exact same place in the financial markets, economy, and pre-election worries as we are now, the same calculation we are using here said the S&P 500 should reached 2800 by January of 2018. 18 months later, that calculation was off by only 3%. (The extra 3% resulting from the from the passage in early 2018 of the Trump Tax Plan.)
Looking to 2021 and beyond, we have entered a new bull market. Given the lag effect of Federal Reserve monetary policies on economic growth and inflation, we expect a positive pickup in both in the second half of 2021. Here, we are on Jeremy Seigel’s side in calling for an upturn in inflation, finally. One can see from the attached chart on real interest rates, that their declines this cycle have been almost exactly 2 years peak to trough, to the week.

The decline in real interest rates from 2010 through late 2012 took almost exactly two years. The latest round of declining real growth started November 2nd, 2018. It was almost exactly on that date that the Federal Reserve made their big mistake and raised interest rates at the same time they stated that they had a long way to go to equalize rates.
Since then, we have been on a consistent downward trend in real growth rates that is now approaching the critical two-year mark. Two years from November 2nd, 2018 would bring us to almost exactly election day. So, we expect both inflation and economic growth to continue into the second half of 2021.
Naturally, we do acknowledge that things remain uncertain. That’s why we remain flexible and respond to changing environments.
However, Oak Harvest’s way of doing things will not change as we head into the second half of 2020, a presidential election, and beyond. We will continue to look for value when others are fearful. We will continue to invest based on facts not feelings, and we will continue to always look to utilize our skill and experience to help our investors achieve their financial objectives.
This has been Chris Perras, CIO of Oak Harvest Financial Group in Houston, Texas and this concludes our second half 2020 outlook.
Though all data and information included in this outlook is believed to be accurate as of the time of publication, it is not guaranteed and no assurance of its accuracy is provided. Nothing in this forecast should not be considered personalized investment advice. No assurance is made that Oak Harvest Investment Services will continue to hold the views expressed herein. Views and opinions may change based on new information, analysis, or reconsideration. Oak Harvest makes no assurance as to the accuracy of any forecast or projection made. Investments or strategies mentioned may not be right for you. Direct investment in an index like the S&P 500 is not possible, and returns of an index like the S&P 500 will not reflect the costs associated with an actual investment portfolio. Returns of an index may not reflect the results seen in your portfolio and your results may differ. Any investment strategy depends on your personal situation, risk tolerance, and objectives and should be undertaken after consulting with your financial advisor. Past performance is not indicative of future results. Investing involves the risk of loss.
Your Roadmap to Retirement

THE RETIREMENT INCOME SHOW
Listen to our radio show hosted by Troy Sharpe at 12 p.m. every Sunday on 740 AM Newsradio 740KTRH.
")
YOUTUBE RETIREMENT CHANNEL
Plan for your retirement more effectively, through informative case studies on challenges faced by people just like you.


