

Weekend Update, September 28th, 2026
WEEKLY MARKET BRIEF
Week ended September 25, 2026 | Published September 27, 2026

Source: AP Index Performance
Key Takeaways Last Week
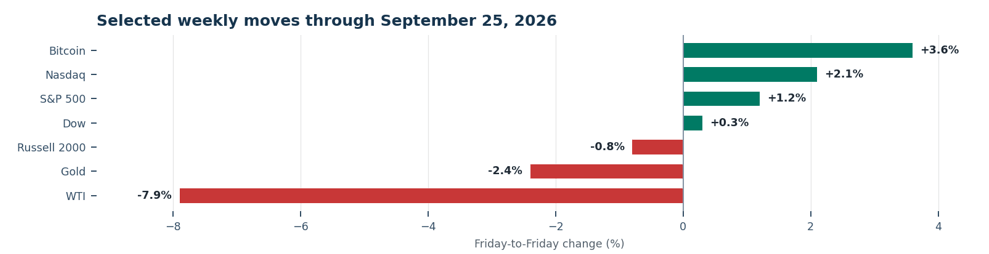
Large-cap growth rebounded, but interest rates rose again. The S&P 500 gained +1.2% and the Nasdaq rose +2.1%. The Dow rose 0.3%, while the Russell 2000 fell 0.8%. The 10-year Treasury finished near 5.16% after strong activity data revived the risk of another Fed hike.
• AI stocks lead. Semiconductors, AI agents, and cloud infrastructure drove the rally. The Nasdaq near AThs.
• Breadth stayed narrow. Small caps declined Only 28% of S&P 500 stocks were above their 50-day average.
• Rates rose on growth optimism. The flash PMI jumped to 58.4;input costs accelerated, pushing the 10-year yield +15 bp higher for the week.
• Oil WTI fell -7.9%, on futures futures roll, while Brent ended near $104 as Middle East supply risk persisted.
• Liquidity tightened into quarter-end. Reserve balances fell $83.6 billion as the Treasury General Account rose $100.1 billion; credit spreads remained orderly near 273 bp.
U.S. Stock Performance – Index and Sector Moves

Price returns and levels use Friday close to Friday close where available. Sources: Associated Press; Nasdaq Dorsey Wright.
Sector leaders. Technology proxy XLK gained +3%. Health care showed relative strength, led by biotechnology and life-sciences names.
Sector laggards. Utilities, communication services, real estate, financials, and energy were the weakest groups.
S&P 500 Stock Leaders and Laggards
The upside centered on health care and selected AI infrastructure; deal and earnings risk drove the downside. Moderna extended its cancer-vaccine momentum, while Paychex sold off despite a small profit beat.
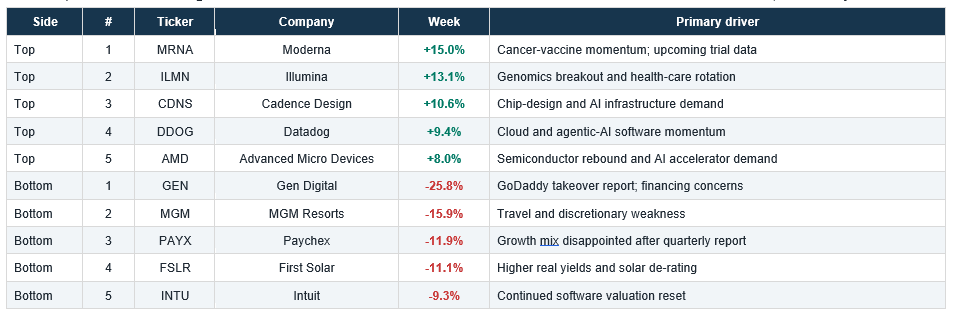
Methodology: weekly stock returns use the CapitalInsightBD screen for September 21 through September 25; catalyst descriptions distinguish reported news from market interpretation.
Breadth & Participation
Index strength remained concentrated. The S&P 500 gained +1.2%, but the Russell 2000 fell -0.8% and nine of 11 groups lower.
International / Global
Europe recovered modestly. The STOXX Europe 600 gained 0.5%. The DAX rose 0.4%, the CAC 40 0.2%, and the FTSE 100 0.3%.
Asia split along the AI and China divide. The Nikkei 225 rose +2.1% as semiconductor shares rallied. The Hang Seng fell 1.0% and the Shanghai Composite declined 0.6%, while investors assessed the U.S.-China summit and the durability of prior trade commitments.
Volatility & Risk Sentiment
Equity volatility remained calm. The VIX closed at 14.87, down -5.1% on Friday. Equity investors treated the week’s rate shock as a rotation rather than a systemic break.
Rates volatility told a different story. The MOVE index closed near 96. High-yield OAS was about 273 bp on September 24th.
Bonds, Credit & Interest Rates

Friday official Treasury constant-maturity data were available through September 24. High-yield OAS is the latest September 24 observation. Source: U.S. Treasury.gov
The bond market carried stress. The five-year yield crossed 5% and the 30-year briefly approached 5.50%. Borrowing costs for housing and long-duration investment rose even as stocks advanced.
Economic Data, Monetary Policy & Earnings
Growth surprised higher. The September flash composite PMI rose to 58.4 from 56.0, the strongest pace in roughly five years, while input costs accelerated at the fastest rate in four years.
Housing improved at the margin. August new-home sales rose 6.4% to a 684,000 annual rate, above the 615,000 consensus. Supply remained high at 8.5 months, and the median price was -5.8% below a year earlier.
Business investment held up. August core nondefense capital-goods orders rose 1.6% to a record level.
Fed risk shifted hawkish. Officials emphasized persistent inflation and resilient activity. Markets assigned a higher probability to another hike at the October meeting.
Earnings stayed selective. AutoZone and KB Home beat expectations, while Paychex and Darden showed that investors were unwilling to reward results that merely met a high bar. Q3 S&P 500 earnings growth is expected near 29%, according to FactSet data cited by AP.
Consumer Stress Commentary
Confidence stayed depressed. Final September Michigan sentiment was 48.1, down from 51.7 in August, while one-year inflation expectations rose to 4.6%.
Affordability is the pressure point. Thirty-year mortgage rates moved above 7%, and gasoline averaged roughly $4.48 early in the week. New-home incentives supported transactions, but borrowing costs and energy bills remain a drag on lower- and middle-income households.
Commodities, Currencies & Macro Assets
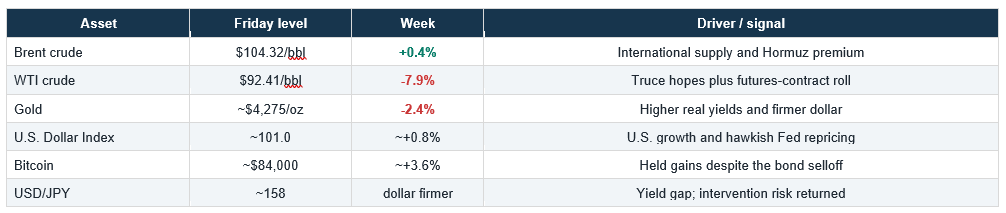
Figures use rounded Friday observations and may reflect different market cutoffs. WTI’s weekly move includes the October-to-November contract roll; Brent is the cleaner like-for-like energy signal. Source: Oil weekly recap, energynow.com
Oil remained the macro transmission channel. Diplomatic reports pushed WTI lower Friday, but Brent stayed above $100. The wide Brent-WTI spread cautions against reading the U.S. contract alone as broad disinflation.
The dollar and gold confirmed the rate move. The dollar gained against every major currency in the weekly FX matrix, while gold fell despite geopolitical risk. Bitcoin’s resilience was a relative-risk signal, not a confirmation of easy financial conditions.
Source: AP Index Performance
Liquidity Conditions
Quarter-end liquidity tightened. Average reserve balances fell $83.6 billion to $2.930 trillion in the week ended September 23. The Treasury General Account rose $100.1 billion to $977.1 billion, while reverse repos declined $21.9 billion.
Flows & Positioning
Equity flows reversed sharply. LSEG Lipper reported $37.6 billion of U.S. equity-fund inflows, the largest in three months and the first inflow in five weeks. Global equity funds attracted $44.1 billion as AI enthusiasm returned.
Positioning stayed barbelled. Large-cap AI, semiconductors, and selected health care drew flows, while small caps, utilities, real estate, and other rate-sensitive groups lagged. Quarter-end rebalancing may amplify bond and equity moves this week.
What Matters This Week
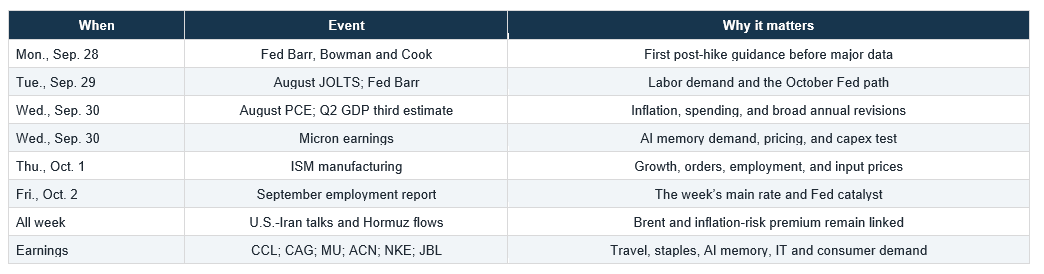
Sources: BLS, BEA, ISM, Federal Reserve calendar, and company earnings calendars. Times and dates are subject to change.
Market Dashboard: The Five Tests
- Rates: A 10-year yield holding above 5.15% would keep pressure on housing, small caps, and long-duration valuations.
- Breadth: The rally needs participation beyond AI and health care; watch equal weight, financials, and the Russell 2000.
- Inflation: August PCE and ISM input prices will determine whether the September Fed hike becomes a sequence.
- Oil: A credible Hormuz reopening path would reduce inflation risk; renewed attacks would restore the Brent premium quickly.
- Credit and liquidity: HY OAS below 300 bp is orderly, but quarter-end reserve pressure and rising all-in yields bear watching together.
Bottom Line
The index rebound narrow. AI and selected health-care shares lifted the S&P 500 and Nasdaq even as small caps and most sectors lagged. Credit stayed calm, but Treasury volatility and a 5.16% 10-year yield tightened financial conditions.
This week is a data-and-duration test. PCE, ISM, and payrolls will determine whether growth can coexist with stable yields. A cooler inflation and continued oil relief would broaden the rally; another upside data surprise could make the bond market the dominant signal again.
Stock Talk
Are Higher Interest Rates Bad for your Retirement Plan?
Selected Sources
AP index performance | Nasdaq Dorsey Wright | U.S. Treasury curve | Fed H.4.1
Michigan sentiment | Census new-home sales | ICI money markets | LSEG fund flows
BEA release schedule | BLS jobs schedule | ISM calendar | Fed calendar
CapitalInsightBD stock screen | Reuters Europe recap | Oil weekly recap
Information only. Figures are rounded; “~” denotes an approximation and “n/a” is used when a reliable comparable value could not be confirmed. This brief is not personalized financial advice or a recommendation to buy or sell any security.
Past performance is no guarantee of future results. Indexes are unmanaged and one cannot invest directly in an index. They do not reflect any fees, expenses or sales charges. The preceding discussion is for informational purposes only. Investing involves risk and no reference to any security listed above should be considered a buy or sell recommendation. Advisory services are provided through Oak Harvest Investment Services, LLC, a registered investment adviser.