

Weekend Update, September 21st, 2026
Week ended September 18, 2026 | Published September 20, 2026

Source: AP index performance
Key Takeaways Last Week
A flat index -headline concealed a narrowing, rate-sensitive market. The S&P 500 slipped -0.1% for a 2nd weekly decline. Nasdaq gained 0.7%. The more rate sensitive Dow fell -1.7% and the Russell 2000 lost -1.5% on the week. Did the Fed begin a new hiking cycle? The 10-year Treasury closed at 5%. Techn stocks carried most of the index during the week.
- The Fed raised 25 bp to 3.75%-4.00%. The 2026 year-end policy rate rose to 4.1%, implying one more hike in the year.
- Breadth weakened. The equal-weight S&P fell -1.3%, small caps lagged, and only health care and technology finished higher.
- Rates delivered tightening. Treasury 2-year at 4.76% and the 10-year at 5.01%; broad high-yield spreads remained near 270 bp.
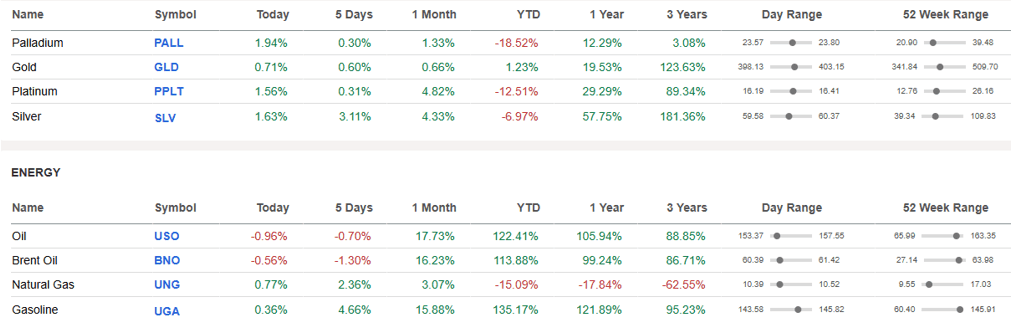
- Oil remained volatile. Brent neared $110 after damage to Saudi infrastructure, then fell to $103 as repair expectations improved.
- Stock dispersion rose. AI optical, memory, and data-center power names led gains; freight, streaming, software, cable, and restaurants sold off. Sector leadership returned to 2q26 playbook on higher growth and real interest rates.
U.S. Stock Performance – Index and Sector Moves
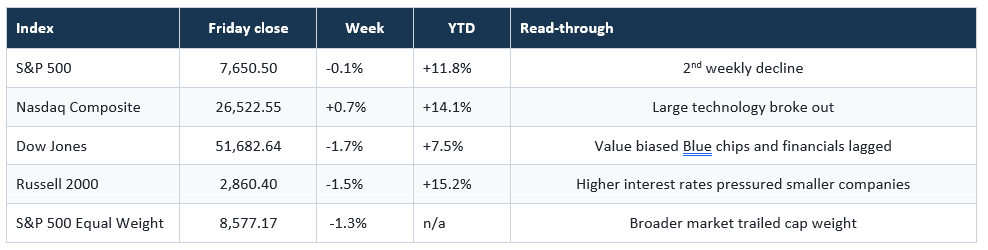
Price returns and levels use Friday close to Friday close where available. Sources: AP; Investing.com equal-weight history.
Sector leaders. Health care rose +1.83% and technology gained +1.03%. The other nine sectors declined.
Sector laggards. Utilities fell -3.04%, financials -2.43%, real estate -2.05%, materials -1.88%, and energy -1.27%.
S&P 500 Stock Leaders and Laggards
The upside returned to AI infrastructure; the downside was broad. Coherent and Generac had large contract catalysts, while Friday semi strength amplified the hardware winners. Oil and shipping freight-cost guidance drove losses.
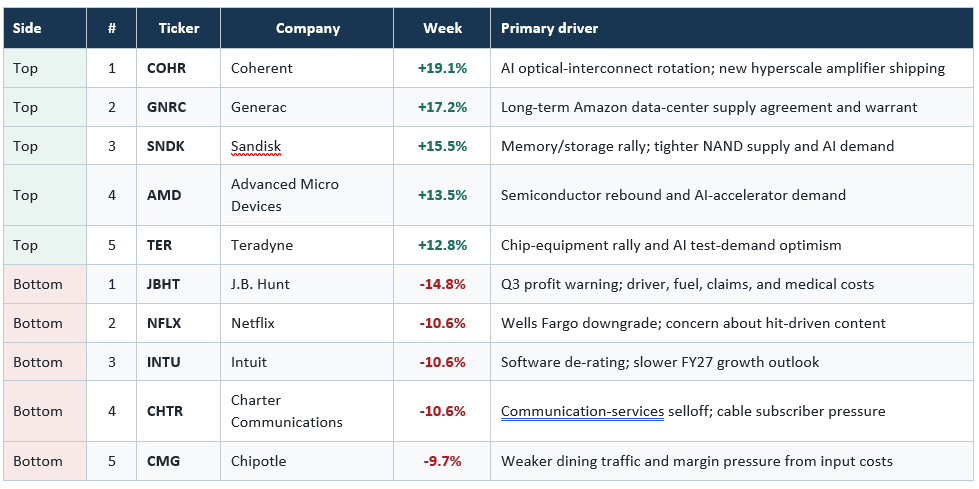
Methodology: CapitalInsightBD S&P 500 weekly screen uses the first session price of September 14 through September 18;.
Breadth & Participation
Breadth narrowed. The equal-weight S&P fell -1.3% versus 0.1% for the capitalization-weighted index. The Russell 2000 lost -1.5%. Only two of 11 sector ETFs advanced.
Friday did not repair the divergence. The S&P rose 0.2%, but equal weight fell -0.5% and only 150 members advanced.
International / Global
Europe weakened; Asia was mixed. The STOXX Europe 600 fell -0.6%, the DAX -1.0%, and the CAC 40 -1.4%. The Nikkei gained 1.6%, while the Hang Seng slipped -0.2%.
Global policy moved toward tightening The Bank of Japan raised its rate 25 bp to 1.25%, the highest in 31 years. The Bank of England held at 3.75% on a 6-3 vote. The common constraint was persistent inflation and elevated energy costs.
Volatility & Risk Sentiment
Equity volatility stayed calm. The VIX closed at 14.81 and fell 13% over five days. The bond volatility MOVE index remained near 80.6, reflecting more uncertainty in rates than in equities.
Credit did not confirm systemic stress. Broad high-yield OAS was approximately 270 bp on September 17, only modestly wider. CCC-and-lower spreads near 1,076 bp showed that strain remained concentrated in the weakest borrowers.
Bonds, Credit & Interest Rates
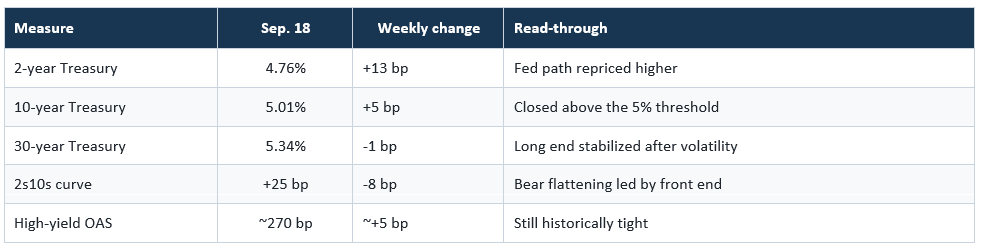
U.S. Treasury CMT closes; High-yield OAS is the latest available September 17 observation.
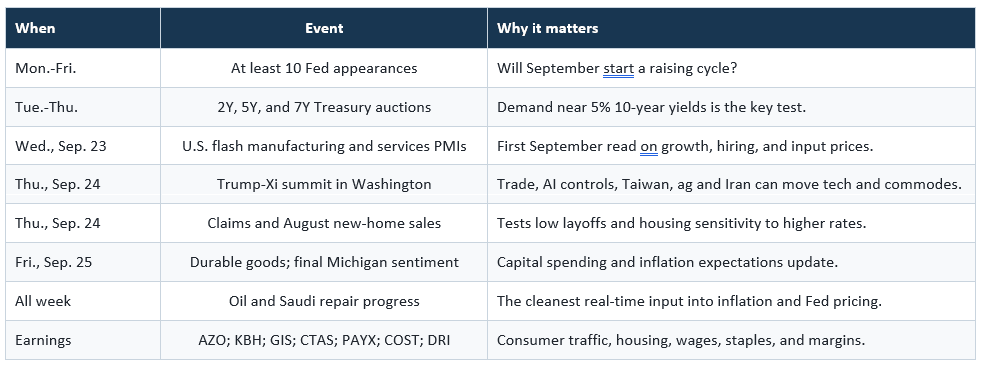
The next supply. $69 billion 2-year, $70 billion 5-year, and $44 billion 7-year auctions will test demand.
Economic Data, Monetary Policy & Earnings
Fed. The FOMC unanimously raised the target range to 3.75%-4.00%. The September medians showed 2026 GDP growth of 2.3%, unemployment at 4.1%, headline PCE inflation at 3.7%, core PCE at 3.4%, and year-end fed funds at 4.1%.
Demand remained firm. August retail sales rose 1.2% month over month, and initial claims fell to 196,000.
Housing and factories were softer. Housing starts fell -2.6% to a 1.275 million annual rate and permits declined to 1.394 million. Manufacturing output fell 0.3%, with capacity utilization at 76.3%.
Earnings. This week’s consumer reads include AutoZone, KB Home, General Mills, Cintas, Paychex, Costco, and Darden.
Consumer Stress Commentary
Hard spending and soft confidence diverged further. Retail sales were strong, but Michigan sentiment fell to 47.8 and one-year inflation expectations rose to 4.6%. Consumers are still spending while reporting mounting concern about prices. K-shape rules.
Fuel and housing are pressure points. Brent approached $110, gasoline and diesel costs remained extreme, builder confidence fell to 32, and a 10-year Treasury yield near 5% kept mortgage affordability lower.
Commodities, Currencies & Macro Assets
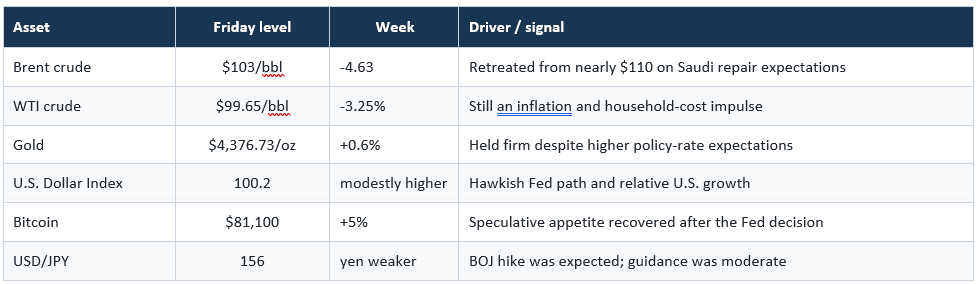
Crude vendors reported unusually wide Friday cash/settlement indications; weekly crude returns are shown as n/a rather than forcing a false precision. Other figures are rounded and may reflect different market cutoffs. Sources: ChatGPT and Bloomberg data
Energy was the week’s transmission channel. The early spike lifted inflation expectations and Treasury yields; the late retreat supported Thursday’s broad rebound.
The dollar and crypto sent mixed messages. Dollar strength reflected the relative U.S. policy path and better econ data, while bitcoin’s rebound and tight credit spreads suggested risk appetite rotated rather than disappeared.
Source: Seeking Alpha
Liquidity Conditions
Fed liquidity provided a modest offset. Average reserve balances rose $22.5 billion to $3.014 trillion in the week ended September 16. The Treasury General Account fell $6.3 billion to $877.0 billion, and reverse repurchase agreements declined.
These movements were too small to neutralize the valuation impact of a 5% 10-year yield.
Flows & Positioning
Equity flows remained cautious. ICI reported money-market assets down $51.97 billion to $7.92 trillion for the week ended September 16. Lipper reported $31.44 billion of U.S. equity-fund redemptions, the fourth consecutive weekly outflow.
Stock action showed a barbell. Investors favored mega-cap growth, AI infrastructure, selected health care, and crypto-linked equities (2q26 playbook) while avoiding interest rate sensitive small caps, utilities, real estate, financials, and much of the Dow.
What Matters This Week
Sources: Federal Reserve calendar, Kiplinger, U.S. Treasury, AP, and company calendars.
Market Dashboard: The Five Tests
- Rates: A sustained 10-year yield above 5% raises the hurdle for long-duration equities and rate-sensitive demand.
- Breadth: Equal weight, financials, cyclicals, and the Russell 2000 have begun lagging.
- Oil: A return toward $110 Brent would revive inflation and Fed-path risk.
- Credit: Broad high-yield OAS below 300 bp remains orderly; widening in both broad HY and CCC debt would be more serious.
- Policy and geopolitics: The Trump-Xi summit can change sentiment around tariffs, AI controls, rare earths, Taiwan, and Iran.
Bottom Line
The market absorbed the Fed hike. Technology and selected health care shares held the S&P 500 nearly flat, but equal weight, small caps, financials, real estate, and utilities weakened. Credit remained orderly and the VIX stayed low.
This week is a breadth-and-rates test. Oil relief and constructive U.S.-China talks would give the market room to absorb a higher-rates. Renewed oil strength or hawkish Fed follow-through would make the 5% 10-year yield the dominant signal.
Stock Talk
Rates Up Stocks Up: Why Higher Interest Rates Haven’t Killed the Stock.
Selected Sources
AP index performance | AP market recap | Fed statement | Fed projections Seeking Alpha Data Sets
U.S. Treasury curve | Federal Reserve H.4.1 | Census retail sales | Census housing
CapitalInsightBD stock screen | Bellwize sector recap | IG global markets | ICI money-market assets
Kiplinger economic calendar | Kiplinger earnings calendar | AP Trump-Xi preview | AP Bank of Japan
Information only. Figures are rounded; “~” denotes an approximation and “n/a” is used when a reliable comparable value could not be confirmed. This brief is not personalized financial advice or a recommendation to buy or sell any security.
Past performance is no guarantee of future results. Indexes are unmanaged and one cannot invest directly in an index. They do not reflect any fees, expenses or sales charges. The preceding discussion is for informational purposes only. Investing involves risk and no reference to any security listed above should be considered a buy or sell recommendation. Advisory services are provided through Oak Harvest Investment Services, LLC, a registered investment adviser