

Weekend Update, September 14th, 2026
Week ended September 11th, 2026
Published Sunday, September 13, 2026 | Informational market brief
Key Takeaways Last Week
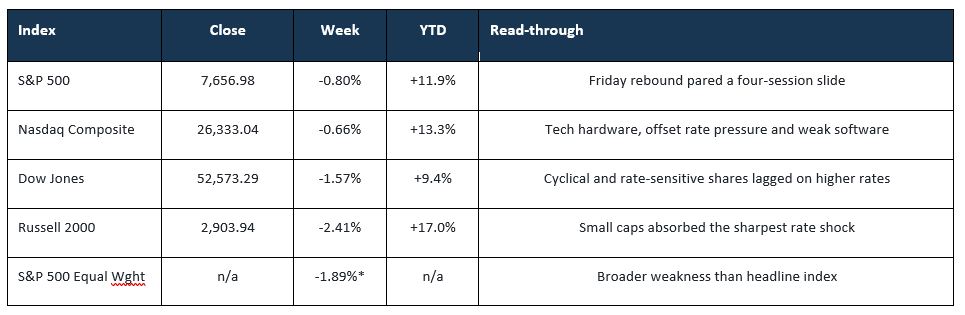
Oil and rates delivered the week’s pressure; technology limited the damage. The S&P 500 fell -0.80%, the Nasdaq Composite dropped -0.66%, the Dow lost -1.57%, and the Russell 2000 dropped -2.41%. Brent and WTI oil gained +9% as Gulf shipping disruptions escalated, pushing Treasury yields sharply higher. Friday’s relief rally followed a pullback in oil, but Fed hike expectations strengthened rather than eased.
- The S&P 500 closed at 7,656, while the equal-weight RSP index fell -1.89%; breadth weakened.
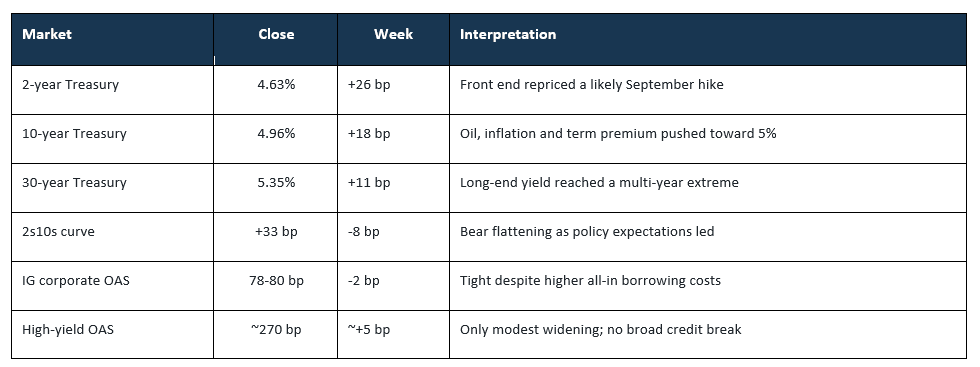
- The 2-year Treasury rose +26 bp to 4.63% and the 10-year rose +18 bp to 4.96%; flattening the yield curve as September Federal Reserve hike pricing firmed.
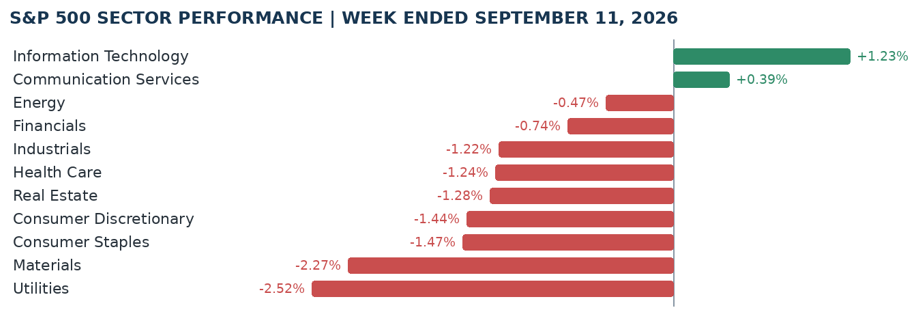
- Technology (+1.23%) was the lone sector up; Utilities (-2.52%) and Materials (-2.27%) were the weakest.
- August CPI rose 0.4% mtm and 3.4% yty; core rose 0.3% and 2.4%. Fed funds priced an >90% chance of a 25 bp hike.
U.S. Stock Performance – Index and Sector Moves
Sources: AP index closes/returns; FinancialContent RSP history. *ETF proxy, September 4 close through September 11 close.
S&P 500 Stock Extremes – Top and Bottom Five
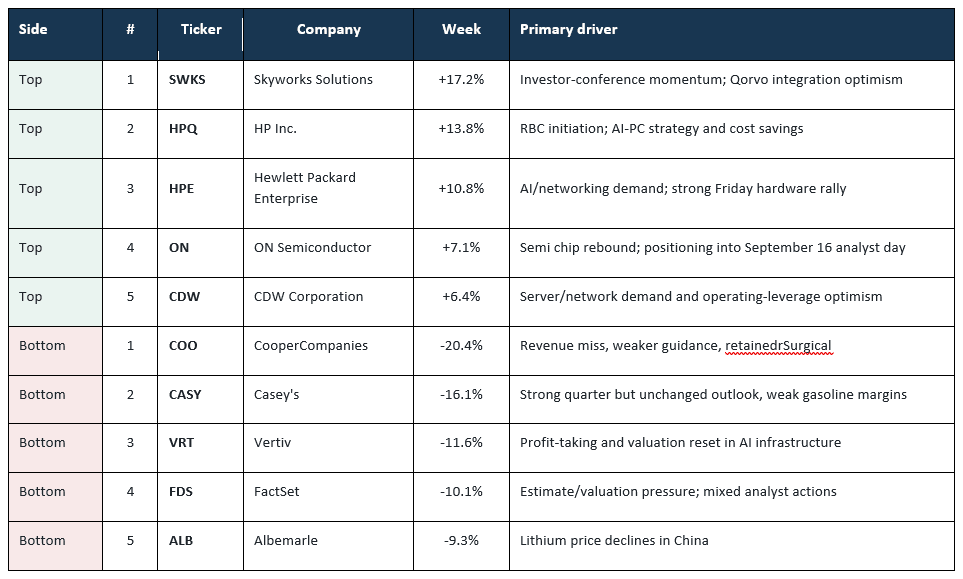
Hardware and AI events dominated. The upside clustered in semiconductors and computing hardware; the downside reflected earnings, guidance, and commodity resets.
Methodology: holiday-shortened weekly screen using the first available session price through Friday, rounded to one decimal. Sources: CapitalInsightBD market-data screen, FinancialContent histories, and company-specific reporting.
Breadth & Participation
- The cap-weighted S&P 500 fell -0.80%; the RSP equal-weight proxy fell -1.89% and the Russell 2000 lost -2.41%. The wide difference points to narrower support from large technology shares.
- Nine of 11 sectors declined. Information Technology and Communication Services gained; all others fell.
- Friday breadth rose with 341 S&P 500 members advancing. Overall weekly breadth fell.
International / Global
Energy-importing markets underperformed. The STOXX Europe 600 fell -1.66% and the Nikkei 225 lost -1.55%. Europe absorbed an oil shock and an ECB rate increase to a 2.50%; Japan fell on higher imported-energy costs and expectations for more BOJ tightening. Hong Kong’s Hang Seng fell roughly -3.5%.
Volatility & Risk Sentiment
Volatility rose. The VIX ended at 15.84 after reaching 17.84 Thursday. Credit spreads stayed tight, suggesting the selloff was driven more by rates and inflation repricing than by a broad shock.
Bonds, Credit & Interest Rates
Sources: U.S. Treasury daily curve, September 4 and 11; CAM/ICE BofA investment-grade OAS; broad high-yield OAS sources through September 11.
Economic Data, Monetary Policy & Earnings
Inflation remained energy heavy. Core CPI rose 0.3% and 2.4%. Gasoline rose 3.9% in August and 27.4% from a year earlier; shelter rose 0.3% on the month.
Producer prices rose. August PPI rose 0.4% and 5.4% year over year. Diesel prices rose 24.1% in the month.
The Fed enters Wednesday with a hike as the base case. The decision and Chair Warsh’s guidance on additional tightening matters.
Earnings are great. FactSet’s puts Q3 S&P 500 EPS growth at 28.5% and revenue growth at 11.9%. Analysts raised the Q3 bottom-up EPS estimate 1.2% during July and August, with Tech and Energy revisions leading.
Consumer Stress Commentary
Household instability rising. September Michigan sentiment fell to 47.8 from 51.7. One-year inflation expectations rose to 4.6% from 4.0%. The 30-year mortgage rate increased to 6.76%, while mortgage applications for the September 4 week were down 19.2% from a year earlier.
K-shaped economy is real. Credit-card balances reached $1.26 trillion in Q2 and lower-income households remain exposed to food, fuel, and financing costs, while prime-card spending and delinquencies are better.
Commodities, Currencies & Macro Assets
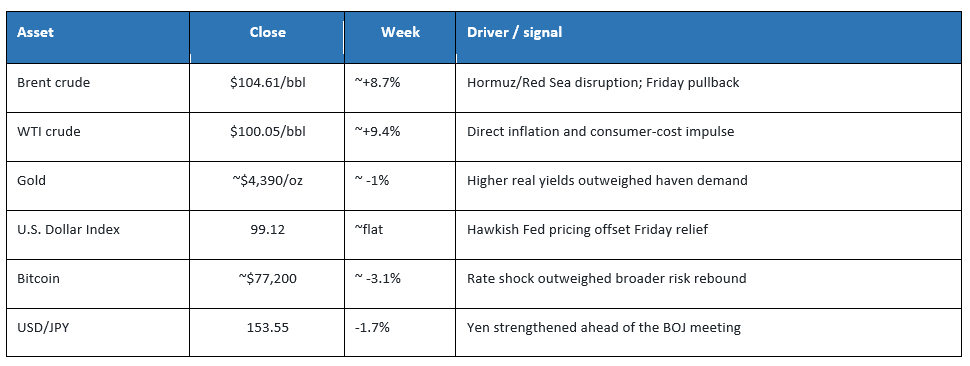
Sources: AP/ICE crude settlements, StockMarketWatch, Investing.com histories, and validated daily crypto histories. Approximate weekly moves use September 4 versus September 11 closes.
Flows & Positioning
Positioning remained cautious but not capitulatory. The latest complete ICI week, ended September 2, showed $8.12 billion of net inflows, including $12.68 billion into bond funds. EPFR’s early-September data showed only $2.2 billion into equity funds, with Energy the strongest sector-fund recipient.
The market is concentrated around two macro hedges. Energy exposure benefits from supply risk, while AI hardware continues to attract selective demand.
What Matters This Week
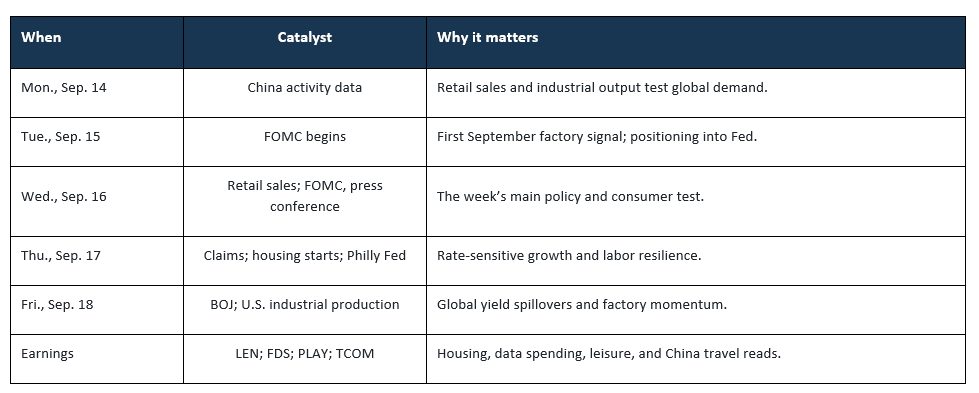
Bottom Line
Friday’s rebound reduced the stress. Oil above $100, a 2-year yield at 4.63%, and a likely Fed hike keep pressure on breadth and rate-sensitive demand. Stable credit and earnings are pluses.
Stock Talk
Many Say it’s 2000 and Dotcom Repeat: maybe that’s the right playbook, but wrong scene?
Selected Sources & Methodology
- AP: Major U.S. index performance, September 11
- NYSE MAC Desk weekly recap
- CapitalInsightBD: S&P 500 weekly sector and stock screen
- FinancialContent: historical market prices
- S. Treasury: Daily Treasury par yield curve
- BLS: August Consumer Price Index
- BLS: August Producer Price Index
- Federal Reserve: H.4.1 balance sheet, September 10
- University of Michigan: September preliminary sentiment
- New York Fed: Q2 2026 Household Debt and Credit
- FactSet: Q3 earnings estimates, September 4
- ICI: Combined long-term fund flows
- Kiplinger: Economic calendar, September 14-18
- Kiplinger: Earnings calendar, September 14-18
Data convention: broad-index and ETF weekly returns use the September 4 close through the September 11 close. The S&P 500 extremes table uses a holiday-shortened market-data screen based on the first available session price through Friday. Figures are rounded as shown; “~” marks an approximate figure or vendor-cut difference. “n/a” is used where a reliable value was not confirmed. This report is informational and is not personalized financial advice.
Past performance is no guarantee of future results. Indexes are unmanaged and one cannot invest directly in an index. They do not reflect any fees, expenses or sales charges. The preceding discussion is for informational purposes only. Investing involves risk and no reference to any security listed above should be considered a buy or sell recommendation. Advisory services are provided through Oak Harvest Investment Services, LLC, a registered investment adviser.