

Weekly Market Update, September 8th, 2026
Informational Market Brief
Week Ending September 4th, 2026
Key Takeaways Last Week
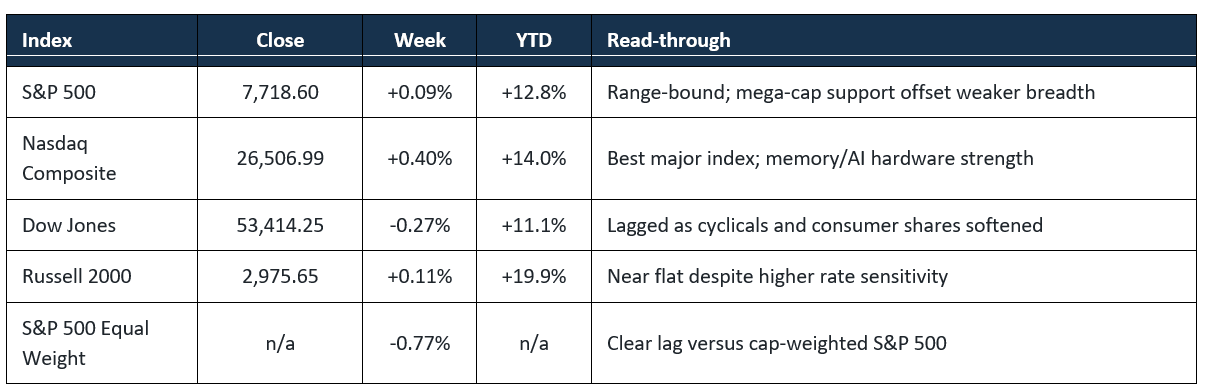
U.S. large-cap indexes finished largely flat. Calm hid more internal rotation. The S&P 500 gained 0.09%, the Nasdaq Composite rose 0.40%, the Dow fell -0.27%, and the Russell 2000 added 0.11%. Energy and memory stocks led as the U.S.-Iran conflict pushed oil sharply higher. Software, consumer discretionary, and the equal-weight S&P 500 lagged. Friday’s 162,000 payroll gain revived the possibility of a September Fed hike and put CPI at the center of the week ahead. The S&P500 concluded August with a +2.6% monthly gain,
- The S&P 500 held its range and closed at 7,718, but equal weight fell -0.77% as breadth worsened.
- Brent oil rose 8% to $96.28 and WTI 10% to $91.48 as the Strait of Hormuz remained disrupted.
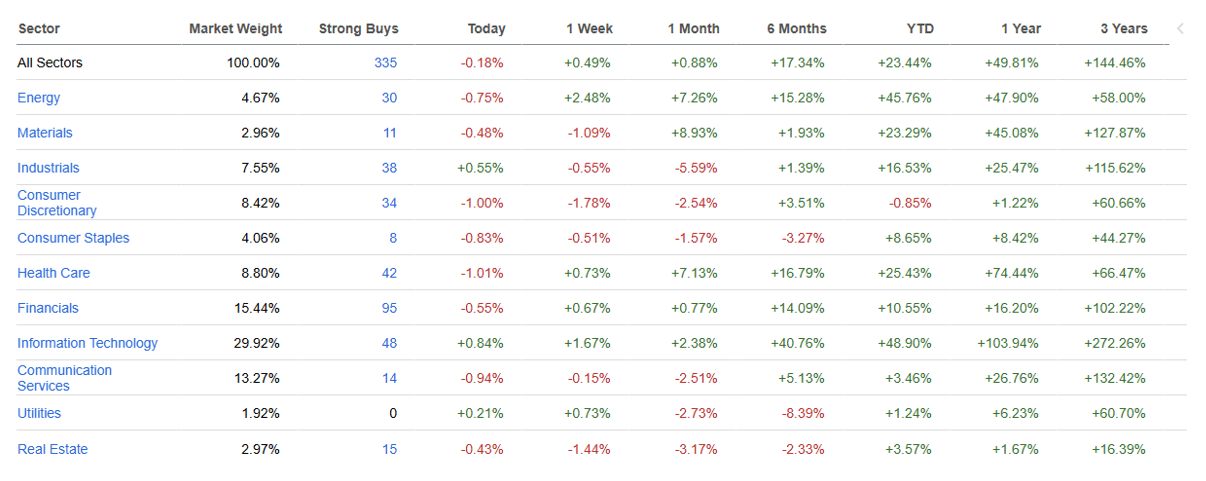
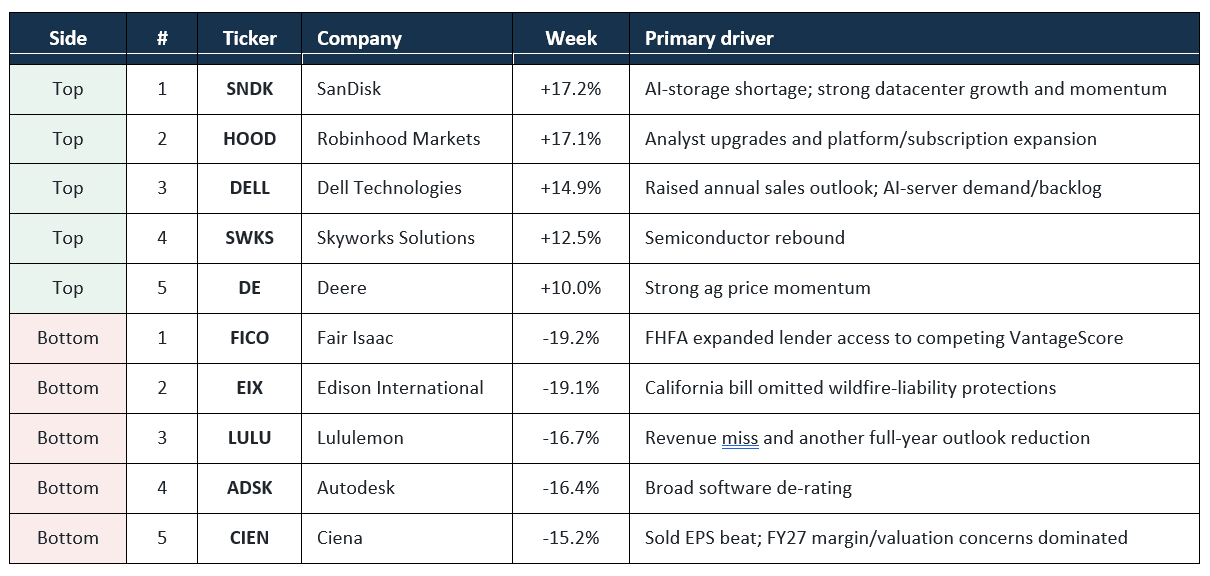
- Hardware beat software: memory and semiconductors rallied, while software fell -4.5%. SanDisk (+17.2%) and Dell (+14.9%) were among the S&P 500 leaders.
- Payrolls rose 162,000 versus roughly 58,000 expected, unemployment held at 4.1%. September hike odds moved back above 50%.
U.S. Stock Performance – Index and Sector Moves
Source: AP index closes/returns; NYSE market recap; Edolab equal-weight return. Figures through September 4, 2026.
Source: Seeking Alpha
S&P 500 Stock Extremes – Top and Bottom Five
Leadership was thematic. 4 of the 5 largest winners were tied to AI infrastructure, capital-markets activity, or data-center construction. Laggards were company-specific policy/earnings shocks and broad software de-rating.
Methodology: split-adjusted close-to-close return from Friday, August 28 through Friday, September 4. Rounded to one decimal. Sources: Ashiran weekly screen, Tiger Brokers weekly winners, and company-specific price histories.
Breadth & Participation
- The cap-weighted S&P 500 rose 0.09% while equal weight fell -0.77%. A sign that calm rested on a narrower group of large stocks.
- 6 of 11 sectors fell. The strongest groups were oil, memory, semiconductors, nuclear power, and biotechnology; software (-4.5%) and cybersecurity (-4.15%) were the weakest tracked themes.
- Small caps were flat and major indexes remain above rising medium-term averages.
International / Global
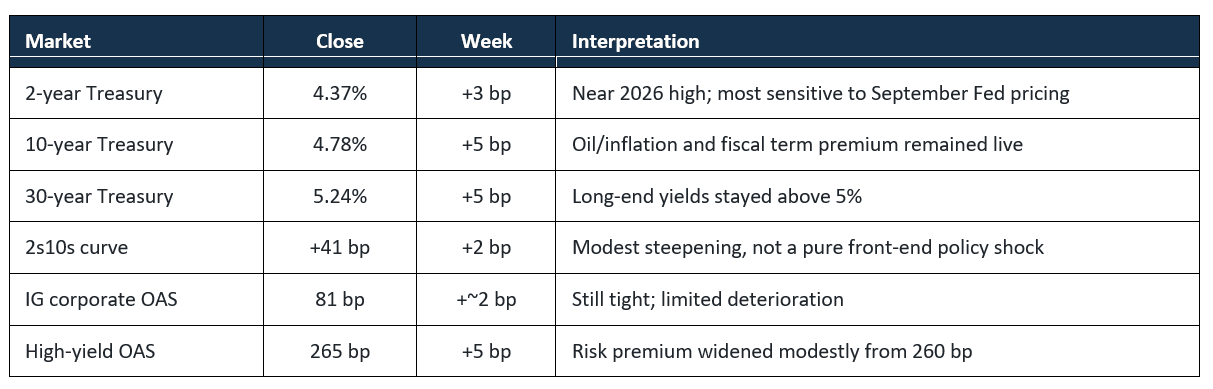
Higher oil and global yields weighed on overseas markets. The STOXX Europe 600 fell -0.8% and Germany’s DAX dropped -1.9%. In Asia, the Nikkei 225 lost -2.1%, the KOSPI -1.5% and Taiwan’s TAIEX rose 0.5%. Brazil’s Ibovespa was the standout, up 5.3%. Japan also saw the 10-year JGB yield reach 3%.
Volatility & Risk Sentiment
Volatility stayed subdued despite geopolitical and rate risk. The VIX ended at 14.53, close to the low end of its 2026 range. Friday breadth was weak (177 S&P 500 advancers versus 322 decliners).
Bonds, Credit & Interest Rates
Sources: U.S. Treasury daily curve; ICE BofA/FRED credit indexes through September 3. Weekly IG change is approximate.
Economic Data, Monetary Policy & Earnings
Labor reaccelerated. August payrolls rose 162,000, more than triple the estimate near 53,000-58,000. Unemployment held at 4.1%; average hourly earnings rose 0.3% month over month and 3.1% year over year.
Fed pricing turned hawkish, but not decisively. The September 15-16 meeting moved to roughly 55%-65% odds of a 25 bp hike after payrolls, versus about 49% one day earlier. Governor Waller said a cooler inflation print would support holding, while hotter inflation could justify a hike
Earnings remain a buffer, with accounting caveats. FactSet’s September 4 snapshot showed 99% of S&P 500 companies had reported Q2 results; 87% beat EPS estimates and 77% beat revenue estimates. Consensus expects Q3 EPS growth of 28.5% and revenue growth of 11.9%, while the forward P/E is 19.5x. Large investment-mark gains at Alphabet and Amazon inflated headline Q2 growth.
Commodities, Currencies & Macro Assets
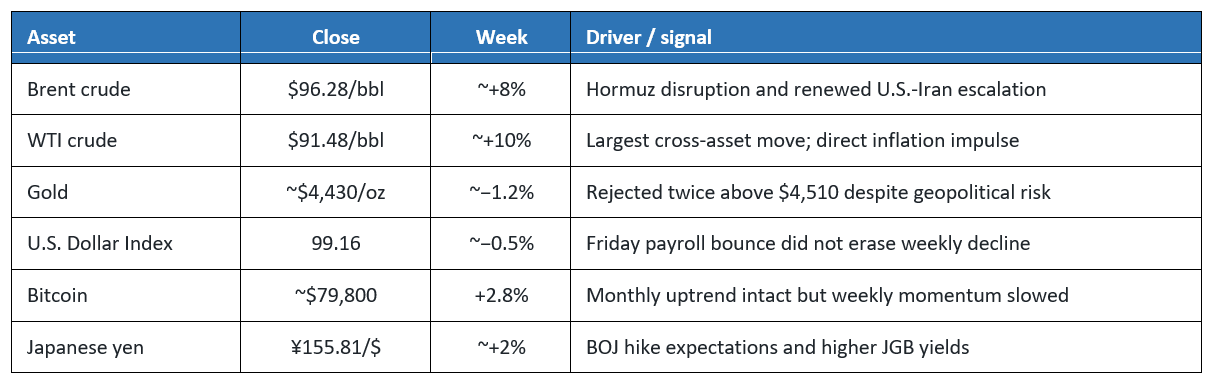
Sources: Compilation from Seeking Alpha Heat Maps
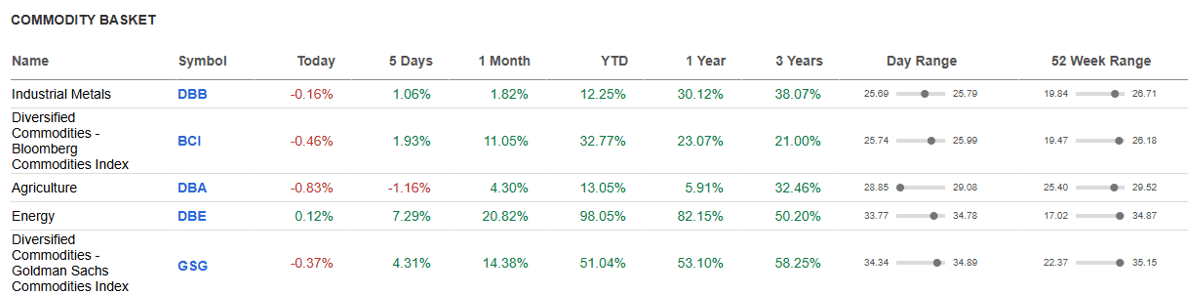
Source: Seeking Alpha
Flows & Positioning
Fund flows became more defensive. BofA/EPFR data showed equity fund outflows of $7.84 billion, the most in nine weeks, alongside $7.76 billion into U.S. high-grade bond funds and $22.89 billion into money markets.
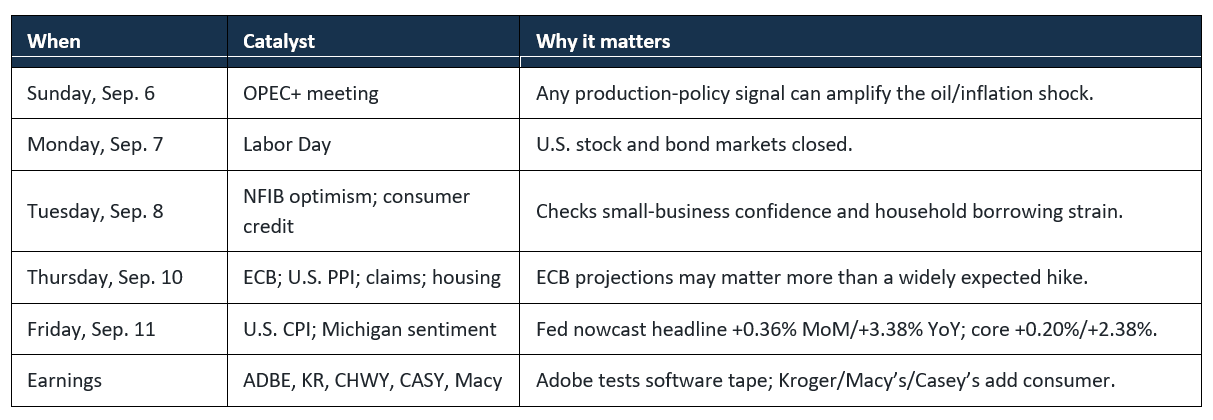
What Matters This Week
Bottom Line
Oil and AI hardware can keep supporting nominal growth and selected earnings, yet the same oil shock raises inflation and rate risk. A cooler CPI with stable credit could broaden participation; a high print, especially could pressure long-duration software and consumer cyclicals first.
Stock Talk
Selected Sources & Methodology
- AP: Major U.S. index performance, September 4
- NYSE MAC Desk weekly recap
- S. Bureau of Labor Statistics: August employment report
- S. Treasury: Daily Treasury par yield curve
- Federal Reserve: H.4.1 balance sheet, September 3
- New York Fed: Q2 2026 Household Debt and Credit
- FactSet: Earnings Insight, September 4
- Kiplinger: Economic calendar, September 7-11
- FRED/ICE BofA: U.S. high-yield option-adjusted spread
- Bellwize: Week of August 31 market wrap
- Edolab: Weekly breadth and thematic performance
- StreetStats: International index performance
- Tiger Brokers: S&P 500 weekly winners
- Seeking Alpha heat maps
Data convention: weekly price returns use the prior Friday close through the current Friday close, rounded as shown. “~” indicates an approximate figure or a value that varies slightly by vendor cut. “n/a” is used where a reliable figure was not confirmed.
Past performance is no guarantee of future results. Indexes are unmanaged and one cannot invest directly in an index. They do not reflect any fees, expenses or sales charges. The preceding discussion is for informational purposes only. Investing involves risk and no reference to any security listed above should be considered a buy or sell recommendation. Advisory services are provided through Oak Harvest Investment Services, LLC, a registered investment adviser.