

07.13.2020 – Weekly Market Update
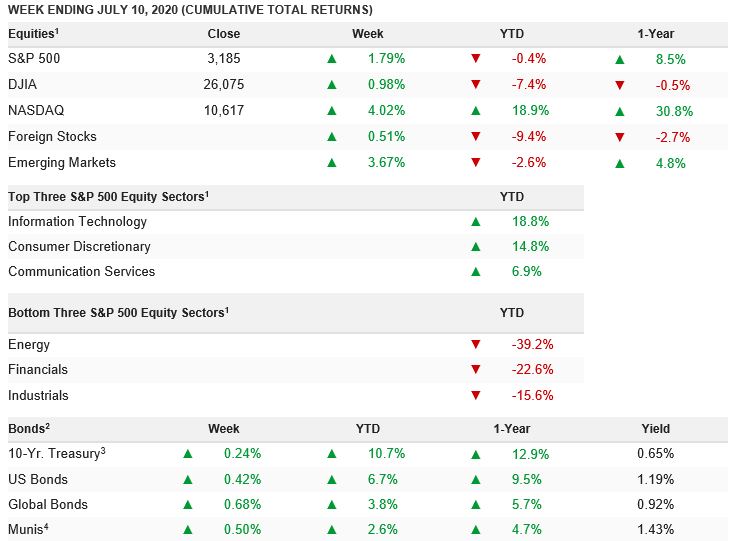
The S&P500 cash index closed the week at 3180, up almost 1.8% on the week (and now down about 1.5% YTD), as the “summer rally” that 99% of financial commentators on TV have missed since Friday June 26th when many were preaching lower targets, continues. Those calling for “trading ranges” and retesting lows continue to garner lots of headline news, and they continue to have missed the rally.
Lumber prices, a leading indicator of the domestic economy as our clients and listeners well know, hit new year and a half highs last week. Moreover, the often discussed “Dr. Copper”, which lags lumber as an indicator, also hit new 52 week highs on an acceleration in both China demand and domestic USA housing demand and supply constraints out of South America. Meanwhile, the network news focuses on issues that lag the markets by weeks if not months.
The June jobs report topped expectations with a 4.8 million advance and a steep 2.2 ppt drop in the unemployment rate to 11.1%. The manufacturing ISM index also crushed expectations, jumping 9.5 points to above the 50 line, and to its best level in a year at 52.6. Auto sales also continued to recover, rising to 13.2 million units last month. Used car sales are soaring. The Citigroup USA “Economic Surprise Index” hit 225 last week. That is its highest reading on record. Almost by a factor of 2!! That is how wrong economists, analysts, and most TV pundits have been about the recovery.
The team at OHFG has pointed to a “V-bottom” in both the stock markets and economy for well over 3 months. Providing early data and historic examples of it being far from “unprecedented”. We have pointed to the normal symmetry in “V-bottoms” the last 10 major recessions over the past one hundred years. The main takeaways based on this historical data:
- The S&P 500 rebounded almost 20% in the 2nd The 10th quarter since World War II when it gained more than 15%. Following the rallies, the index was alwaysup the next 3 months, for an average of 9%. Smallest advance? 4%.
- “Breadth thrust” extensions. (When at least 90% of all S&P 500 stocks surpass their 50-day moving average). This measure was reached May 26. In the prior 19 times this has occurred since 1967, the S&P was alwaysup over the following year, by an average of 17%.
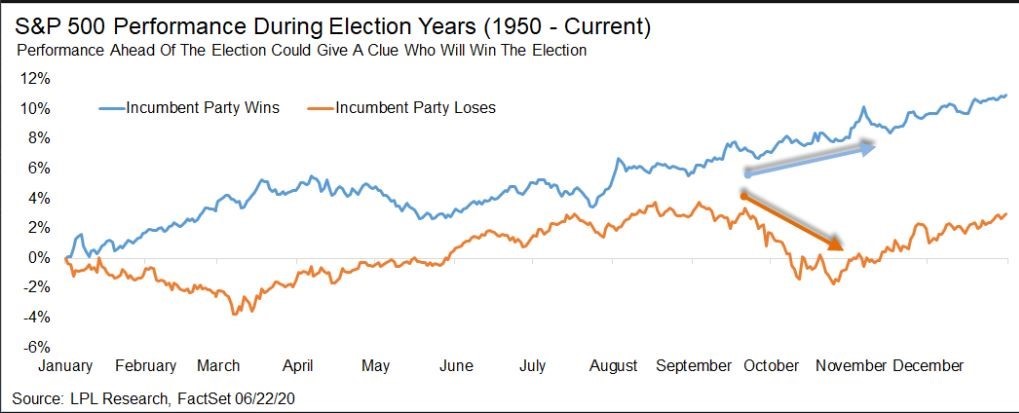
- Election year concerns. Stocks usually do well in election years, it does not matter who wins. Yes, they usually do quite poorly in the quarter leading up to an election in years when the incumbent party loses the White House – see the attached chart. However, the big takeaway is they still have finished the year up, historically speaking.
So, what’s next? Well our view is that the “normal” summer rally should extend into the very end of July and should then may slow in August as investors focus on the normal “summer slowdown” in the economy, re-opening schools, and the upcoming election in November. We expect a summer consolidation and backfilling into October.
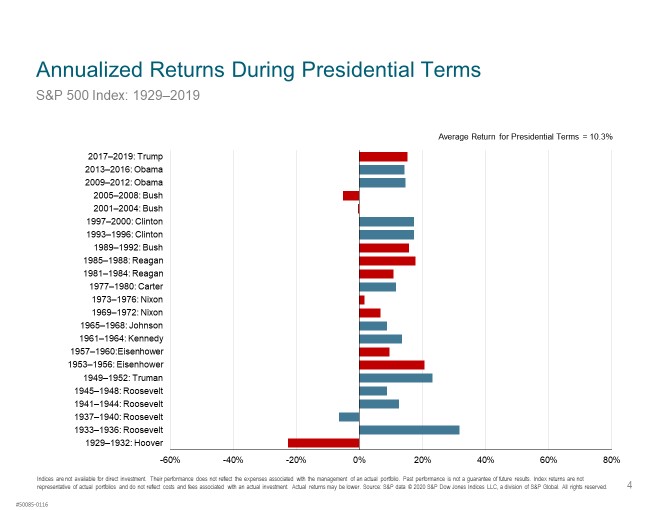
We have included the “Election year” chart once again for your review. You can pick who you think will win, and see what the market’s path has historically been. But investors, please remember, as you can see in the table, over time, say beyond 6 months to a year, it really has not mattered who won. According to a 2019-Dimensional Funds report, the market has been positive overall in 19 out of the 23 Presidential election years from 1928-2016, only showing negative returns four times.
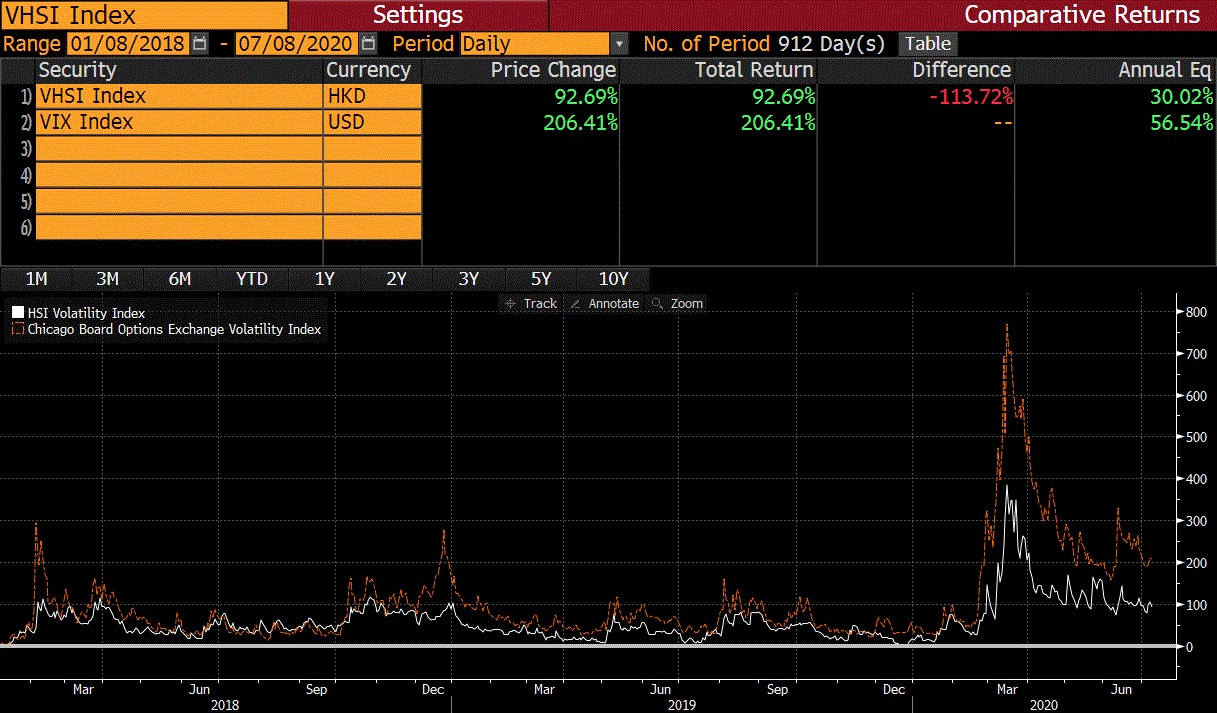
We have attached 2 additional charts to ponder. They are the S&P500 stock market volatility versus China’s stock market volatility for 2 succinct time periods. The two-time frames are July 2016 through the Trump tax plan passage in February 2018, and the second time period from the Trump tax plan passage in February 2018 through now.
What readers will see is that ever since the White House has turned its attention to fighting China and other allies on trade, away from growing our domestic economy, the S&P500 has been over TWICE as volatile as China. Maybe a new administration will create an environment of lower volatility? My belief is that should Biden look like the early winner, a large part of the increase in taxes that would likely be coming, will be anticipated this summer, and that lower volatility in 2021 would likely offset the cuts in earnings in the S&P500.

Weekly market updates contain general information and expresses views of Oak Harvest Investment Services. Data, Articles, and information cited are believed to be reliable at the time of creation, but are not guaranteed. Nothing in this content is intended as, nor should it be regarded as, personalized investment advice. Strategies and ideas discussed may not be right for you. Views and opinions expressed may change without notice and do not constitute a recommendation, or an offer or solicitation to buy or sell securities. In addition, Oak Harvest makes no assurance as to the accuracy of any forecast made. Past performance is not indicative of future results. Investing involves the risk of loss.

